The Renko chart doesn’t have candlesticks, but “bricks”. “Renko” is probably derived from the Japanese word for brick: Renga. Candlesticks are drawn over a period of time, and the bricks on a Renko chart are drawn once price has moved an x amount.
I found out that by using a “Renko” chart, I can cut out a lot of noise on the chart. It also cleans up sideways indecisive periods. It cuts out the dimension of time in its entirety! Just look at this example, here you see 2 charts, an ordinary candlestick chart and a Renko chart. I often use a Renko chart to help me draw support and resistance levels:
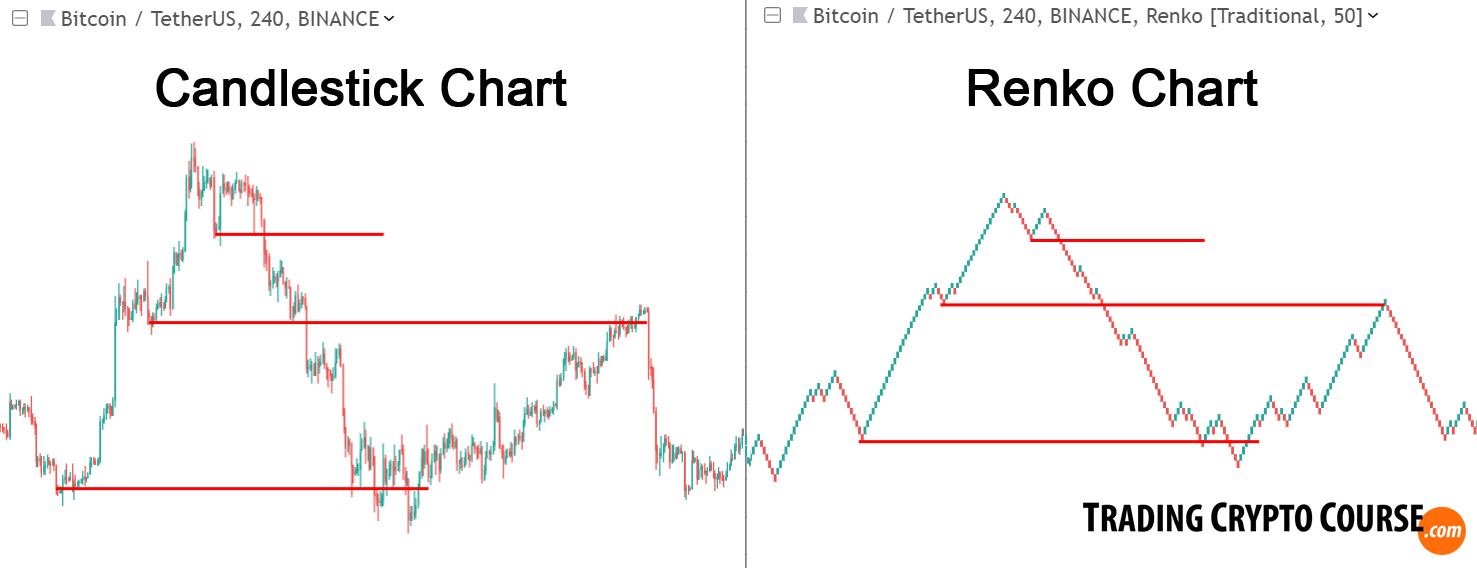
The fact that the bricks on a Renko chart are plotted once price moved an x amount, helps to filter out smaller fluctuations. Sometimes it can take 1 minute or even less to move that x amount, and sometimes it takes a day or longer. That doesn’t matter for the Renko chart, as it only takes price into consideration. The element of time is completely absent on a Renko chart. As you can see in the above example this results in a much smoother chart. Bricks (or “boxes”) are never next to eachother.
- When price increased with an x amount (higher than the top of the previous brick), then the next brick is drawn up from the top-right corner of the previous brick.
- When price decreased with an x amount (lower than the bottom of the previous brick), then the next brick is drawn down from the bottom-right corner of the previous brick.
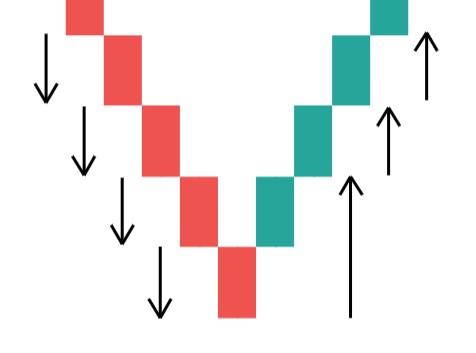
As you can see in this example, at reversal point, the price actually has to move 2 times the set amount to draw a new brick.
There are 2 kind of settings you can use for a Renko chart:
- Traditional: This means you set an x amount that price has to move to draw a brick.
- Average True Range (ATR): This way you use the ATR as dynamic amount to draw a brick. The ATR is the typical amount an asset fluctuated in a specific previous period.
Although Renko charts are very helpful, especially for drawing chart structures, like supports and resistances, I wouldn’t use these charts without any other indicators and confirmation. Always use this in a solid strategy, combined with other tools that offer different views on the same trade setup.
In my free lesson plan, you will learn the most important trading basics for free, you can start immediately:
Or Enroll in the Pro Course & Become a Pro Trader!