The most basic way to determine an early trend, is by looking for reversals in chart structures. For an uptrend this normally means you want price to make a higher low, and a higher high. I actually prefer it if price also confirms that higher high, by breaking above it after a retracement.
But first let’s look closer at a higher low. What does it actually take to make a higher low.
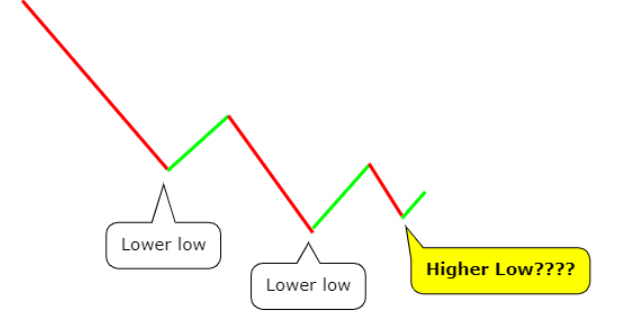
Is this a higher low? Let’s look at what happens next:
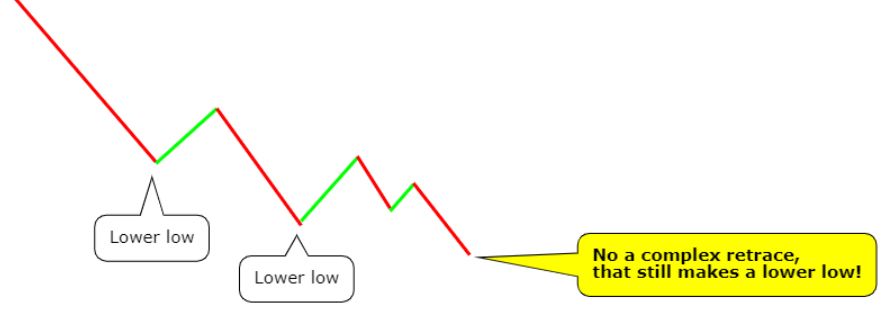
No, it turns out it wasn’t a higher low at all, it was a complex retrace, that still resulted in a lower low.
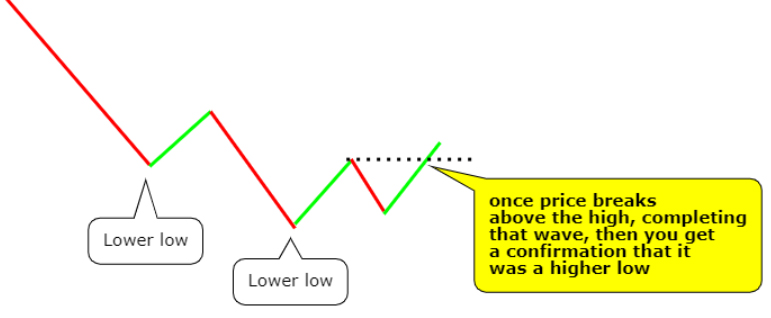
What we need is price to break above the previous high to get the confirmation that this low was actually a higher low:
Many traders buy this breakout, but for me this only confirms a higher low, and I still prefer a higher high also, to confirm the reversal to the upside, like this:
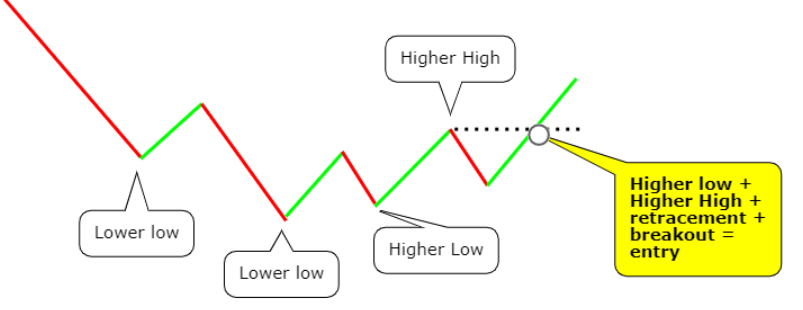
For me the above example is the ideal chart pattern confirmation for a new uptrend. Many traders will call this too conservative, but it has helped me avoid many fake breakouts and reversals, it is also a good protection in “whippy” markets and undecisive markets.
Unfortunately charts won’t always work this way. Crypto markets are often very manipulated, so in crypto breakouts often happen in an instant, without a clear pattern prior to it. That is why I use extra tools to determine the trend. One of them being a moving average.
Moving Average
The first indicator I use, is the Moving Average (MA), one of the most used indicators in technical analysis (TA). By averaging the price, you:
- eliminate random price movements
- focus on a larger pattern
Because an average is based on previous prices, the MA is a lagging, or trend-following, indicator. There are 2 types of MA’s:
- Simple Moving Average (SMA)
- Exponential Moving Average (EMA)
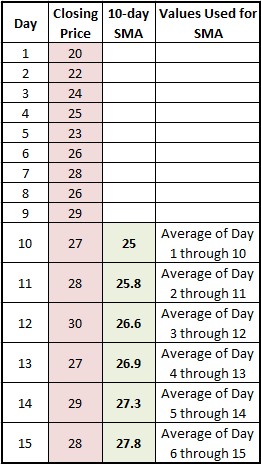
The latter gives more weight to recent prices. In my strategy the 50 period SMA plays a central role. It is the SMA from the previous 50 candles. So when using an 1 hour chart, it represents the MA over the past 50 hours. In the above example I show you how different period SMA’s are calculated.
Many traders use SMA’s. In many different ways.
For example, I like to use it like this:
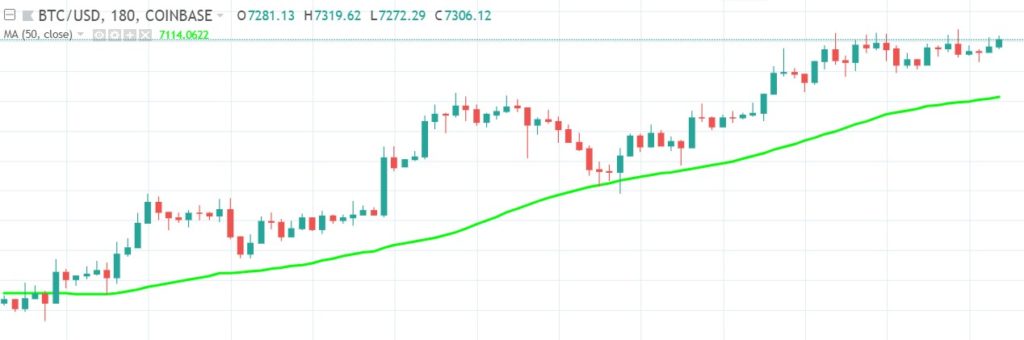
- when a SMA is sloping up, this indicates an uptrend
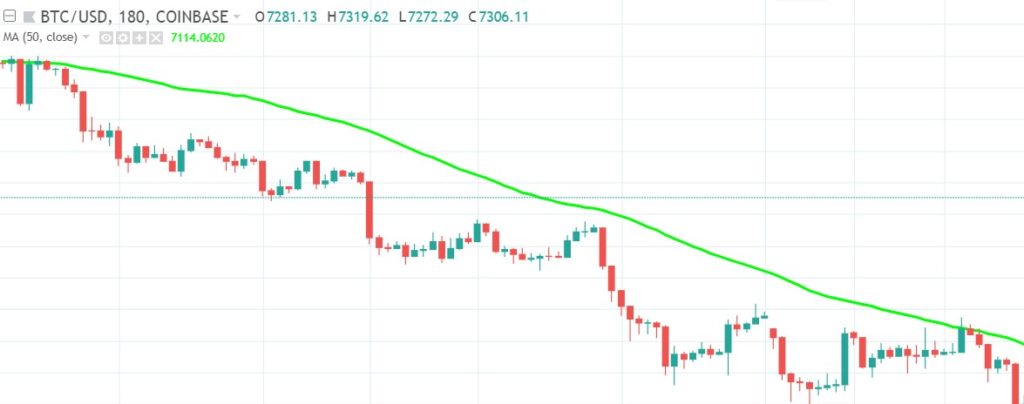
- when a SMA is sloping down, this indicates a downtrend
- when it goes sideways, there is no trend and I avoid the trade
The Trend is your Friend
The 50 period Simple Moving Average (SMA50) is my most important indicator. I only go long when the SMA50 slopes up, and only go short when it slopes down. It is the first indicator I look at. Besides the slope it is also important to know if price is above or below the MA50 and its relation to other MA’s.
There are generally two kind of setups:
- SMA50 slopes up, while price is above it
- SMA50 slopes up, while price is below it
The former is seen more frequent, but has a lower win-rate, the latter is more rare, but has a very high win-rate. The latter is my favorite trade setup, the “reversion-to-the-mean” trade.

In the above example, the first 3 arrows represent the more frequent former setup, the last arrow indicates the latter more rare setup. So as you can see I prefer to buy at the bottom of the retraces in an uptrend (or the tops of the retraces in an downtrend if I decide to go short).
As you can see the SMA50 acts as support here. Traders often use MA’s as dynamic support and resistance levels. They are not static as normal support and resistance lines, but change constantly because of price action.
In an uptrend the SMA50 acts as support:
In a downtrend the SMA50 acts as resistance:
You have to treat these lines the same as your support and resistance lines. So when price breaks through it, it doesn’t immediately mean that the line doesn’t hold. Supports and resistances are zones, not fine lines. The same is true for MA’s.
Always remember:
- not all traders use the same timeframes
- not all traders use the same MA periods
- not all traders place their orders at the exact same prices
Often when price breaks below an upsloping SMA50, it doesn’t necessarily mean a trend-reversal is coming, on the contrary, in most cases the price gets pulled back to the SMA50 or even higher.
As I said before this is my favorite trade setup:
SMA50 slopes up while price is below it. This is the “MEAN REVERSION” trade.
The most important part of this trade strategy is the right timing of the end of the retracement. When you find your entry point at the bottom, it is very important that the SMA50 is still sloping up, meaning the trend is still is bullish.
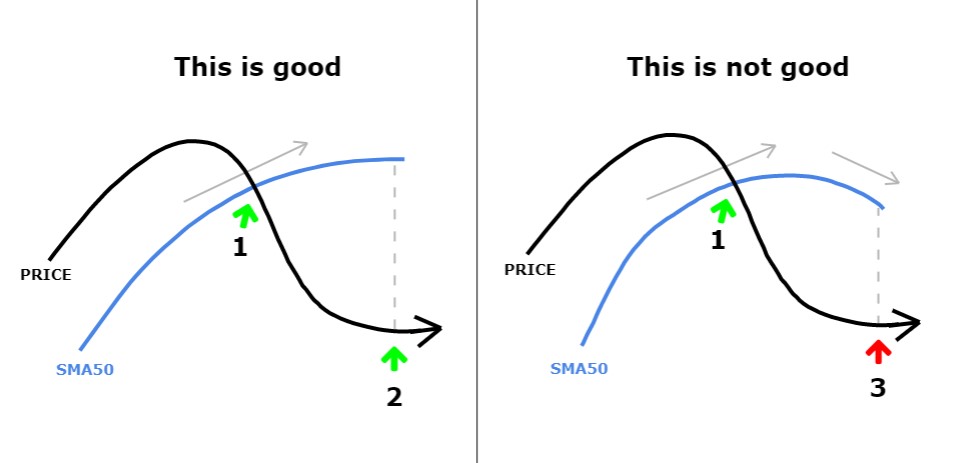
I found out that often when at the bottom of the retracement, the SMA50 is sloping sideways or downward, the odds turn against you, and there is a higher probability price won’t reach the SMA50 anymore. In fact the downsloping SMA50 signals a reversal to the downtrend.
Just like regular support en resistance lines, MA’s also have support-resistance reversals. That means that when a resistance (or support) is broken, then it often turns into a support (or resistance).
To get a better picture of how price behaves you can always switch to a higher timeframe. This can filter out the noise, and give you a better picture of the overall trend. To ignore the higher timeframes is a well known beginners mistake.
When I buy I never want to buy too late into a trend. I count the waves, or cycles, like in this example:

I found out that after the third wave it is more dangerous to enter.
I found the best place to buy is in the first, second or third wave, but after the third wave odds turn against you more often. So I ONLY trade early in a trend, the earlier the better.
To summarize the first step:
- I want to trade the direction of the trend
- The trend is determined by the slope of the SMA50
- I want to trade early in a trend, preferrably the first 3 waves
- I want to know if price is above or below it.
As you know my KISS trading system consists of 7 steps.
Although very important, the trend is only the first step.
You are now ready to make the next step. And remember:
Never skip a step, or you might fall.
Keep it simple!
Click on the next button to go to the chapter 2: Momentum and Volume