Chapter 6.2: Orderbook Advanced

Although the depth chart is an indispensable tool, I continuously look for new  ways to read the markets. Last year I started doing a far more advanced orderbook analysis. For this I use the orderbook analysis tools from trdr.io. In this lesson I like to show you how I use this tool in practice. Like me you will also see how this tool fits perfectly into the trading system, and actually gives a higher-granularity perspective on the orderbook.

I will explain how I use trdr.io. But keep in mind that the settings that I provide right here is only for Bitcoin. Most coins need their own settings. And settings will change over time. So these settings are just to give you a head start.

When you subscribe to trdr.io you’ll get access to the TRDR Academy with more detailed guides to setting the indicators. I have also written an risk management course for their Academy (that’s actually quite similar to the risk management lesson in this course). I’m not affiliated with TRDR, I just really like to use their product. In case you like to sign up to their service, please consider using my affiliate link:

https://trdr.io/a/coincarl

It’s actually a couple of things I’m looking at, I’ll explain it step by step:

Orderbook  Depth Overlay

The first indicator we look at is the “orderbook depth overlay”. For me this is the most important orderbook analysis tool. It’s what got me interested in trdr. For me this is what trdr is all about. 

The “orderbook depth overlay” calculates the ratio between bids and asks for each orderbook level. This ratio visualizes the bid vs. ask pressure.  This ratio is then plotted on the chart. And as you will see, we can switch levels on and off, and change colors for specific ratio’s and orderbook levels. The higher the bid/ask pressure, the stronger that support/resistance level probably is. So it makes sense to focus on the highest bid/ask pressures. That’s why I give those a striking color.

You can choose 1 exchange (your current chart), or the “orderbook depth overlay aggregated” version, where you can select multiple exchanges.
You can also choose which orderbook range you want, these options are:

As an example, I now show you a commonly used: Orderbook Depth Overlay (0 – 10 %).

And these are the indicator settings I use:

And I give the indicator a very custom styling:
(but of course you can play around with these settings to get the best fit for a particular coin)

So it’s actually quite simple: uncheck 0-1% for bid and ask, and give a bright color for ranges
19/20. I came across many users who use dark mode and color level 19/20 yellow (but for me yellow is not clear enough in light mode).

Rules

These are the rules I like to use:

  • Preferably wait for a brightly colored (level 19/20) signal at 15 minute candle close.
  • 5 minute close is possible but is a little less reliable, in that case I wait for more
    colored candles.
  • Because price can make a lower low, I prefer to enter a trade in multiple steps, each step double the volume compared to the previous step. You can only add to a position that moves against you, in case the reason to be in that position is still valid. As soon as that reason breaks you should exit it asap. So although I like to double down on my positions, I will respect the stop-loss level no matter what happens.

This is what the signals look like:

So I wait for the strongest signals. Sometimes this means no signals for 4 days and
sometimes 3 signals per day. Patience is important in trading.
I also use a “trend bias” indicator, with these settings:

“Orderbook Depth Overlay (aggregation) 0-10% (70,20,20)

Rest of the color settings are the same as the main overlay.

It gives a picture of the general sentiment:

But the actual signals come from the other overlay settings:

Even short signals:

As you can see I use Binance spot for the signals. I do this because Binance spot has the best
volume of all exchanges.

Orderbook Depth (non overlay)

Same as above overlay indicators, but this time not as chart overlay, but independent oscillator
“Orderbook Depth (0-10%). The settings:

This takes the total orderbook liquidity, so bid + sell pressure, adds it up and puts it as a line
on the indicator. Make sure you make the line quite flat, so significant drops actually stand
out. Every time we get a signal from indicator nr.1, then nr.2 can be used as extra confirmation:

A drop in this line indicates a liquidity drop in the total orderbook, this means that the price
action had a lot of impact on the book, many orders were executed, spoofers have pulled
orders, removed unfilled orders, liquidations at futures exchange etc.
We see this extra confirmation is good when the book does not respond when we receive a
signal from nr.1, as in this example:

We do not see real strong liquidity drop-off at the first short (or sell) signals, but then at the
higher blue signals we do get a liquidity drop-off. This can help us get better entries and
exits, and to get only the strongest signals with the most impact on the book.
Then I have another variant of this indicator with these settings:

That paints this picture:

I put 2 lines on this indicator (1300 and -1300). If in case of buy / long signals this indicator is
green and above the top line, it is very strong.
If in the case of a sell / short signals this indicator is red and below the bottom line, it is a
strong signal.

Here you get the previous 3 indicators combined:

Orderbook Top Levels

“Orderbook Top Levels”. This indicator prints the order walls largest walls as lines on the
chart.

I use major s/r levels as confirmation of the earlier signals. The strongest and highest probability signals take place at major s/r levels:

Very interesting information, as you can see how these walls develop and influence price
over time:

Big Market Orders

I look for large market orders of more than 100k.

In the trades window, you can enter “> 100k“. Large players manipulate the market using big market orders. If you see large orders coming through here, you know this could have an effect on price, especially if it happens just before a major candle close or near a wall. So time and price where this occurs is important.

Orderbook Changes

This indicator looks at the number of added and removed orders per price level and sets in a
chart. The more additions / removals the wider the bar.
Price tends to move from wider (dynamic levels) to narrow levels, best are empty levels, which are often stop-loss levels for algorithms. That’s how I determine the trading range between those stop loss levels.
You can look back on different timeframes, 5min gives the most recent info but is also the most volatile. 1 hour is also good to use, but not after price has just moved a lot.
If you click on a bid and ask price level, you get this:

(make sure you click Sticky on ask and bid, this ensures that it always automatically selects
best bid and ask)
And now notice these numbers: 

This is the “delta”. Green means more added orders for that price level, red means more
orders removed for that level.
My experience is that if, for example, the ask side is green and has a much higher delta, then
the price is going down / will go down.
If the bid side (bottom) has a high green delta, then price usually goes up.
So this indicator shows when price reverses from one side to the other, that’s why it’s also
called the flipper indicator and it helps people find reversals on short TF’s.
For me the first 3 indicators are the most important to start with. Those give me the actual signals I want to buy/sell.
The large market orders and orderbook changes delta I use to zoom in on what people are
doing at a certain level, but that’s really short timeframe sentiment.
I combine this trdr orderbook analysis with s/r levels, moving averages, RSI divergences and
with Fibonacci levels, that’s all.
For example, you see that fibonacci levels and orderbook changes levels often confirm each
other, this gives an insight into what algo’s do:

Orderbook changes “gaps” are often stop-loss levels as used by algorithmic trading bots.

Otherwise I just use the outer edge as the trading range in the context of the timeframe I
am looking at.

And the orderbook top levels, you can also show the top 5 instead of top 10, this saves
some mess on your screen. You can see the top 5 major walls.
It’s very nice to look at major walls near price. For example when this wall was pulled, price
next went up:

This is how I like to look for orderbook confluence:

Colored bid pressure signals, near major orderbook level, while orderbook showed a
liquidity drop-off. Still it was not very bullish (no bull-run)

The second orderbook depth indicator offers an extra insight:

If I want to go long with great upside expectation, I prefer to see that indicator green, best if
it is above the top line. It represents a kind of trend bias / sentiment for me. It makes the
difference between a retracement or a reversal.

So this is the end of the advanced orderbook analysis using the trdr tool. A lot of information to digest. Please remember that all settings were optimized for Bitcoin. Make sure to test your settings and signals on historical price charts. And remember that just as markets are dynamic, orderbooks are as well. So it isn’t a holy grail, but when used the right way, and combined with all the other steps, you’ll get a very powerful setup.

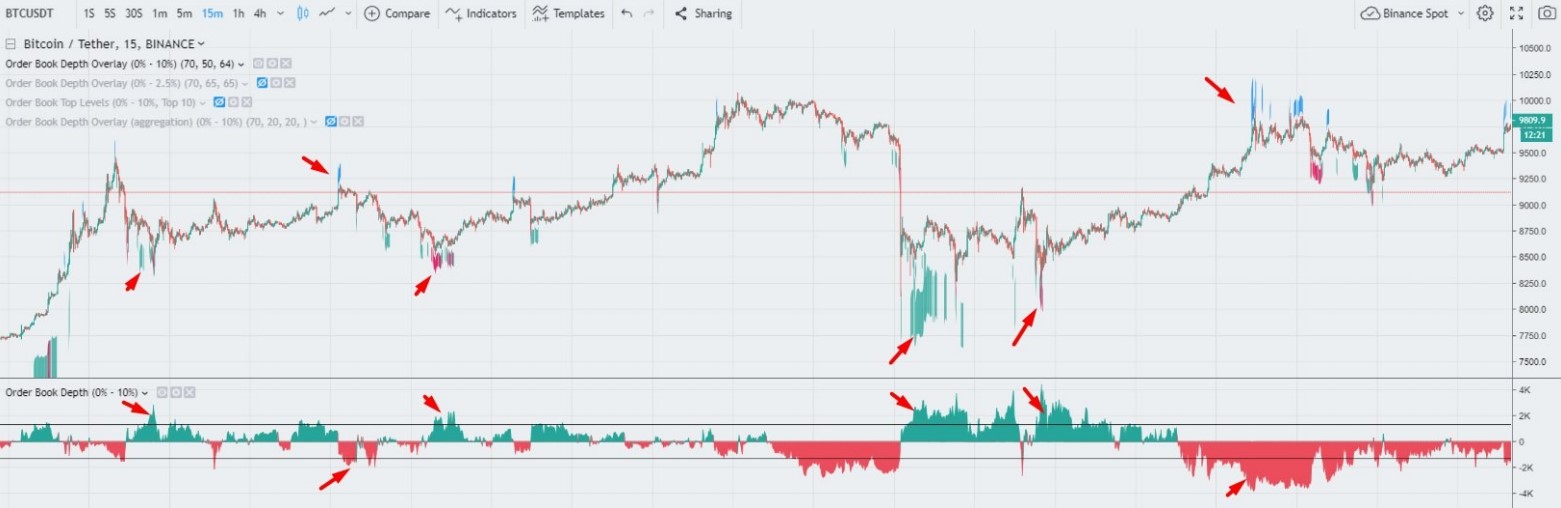
Most important take-away for me, is that these signals behave differently in trending markets and sideways markets. So know how you want to trade each type, and always use it in combination with other confirmation, like trend, momentum, multiple timeframes, etc.

In the next chapter I will use the trdr tool to take a look at sentiment analysis.

Click on the next button to go to the chapter 6.3: Sentiment Analysis