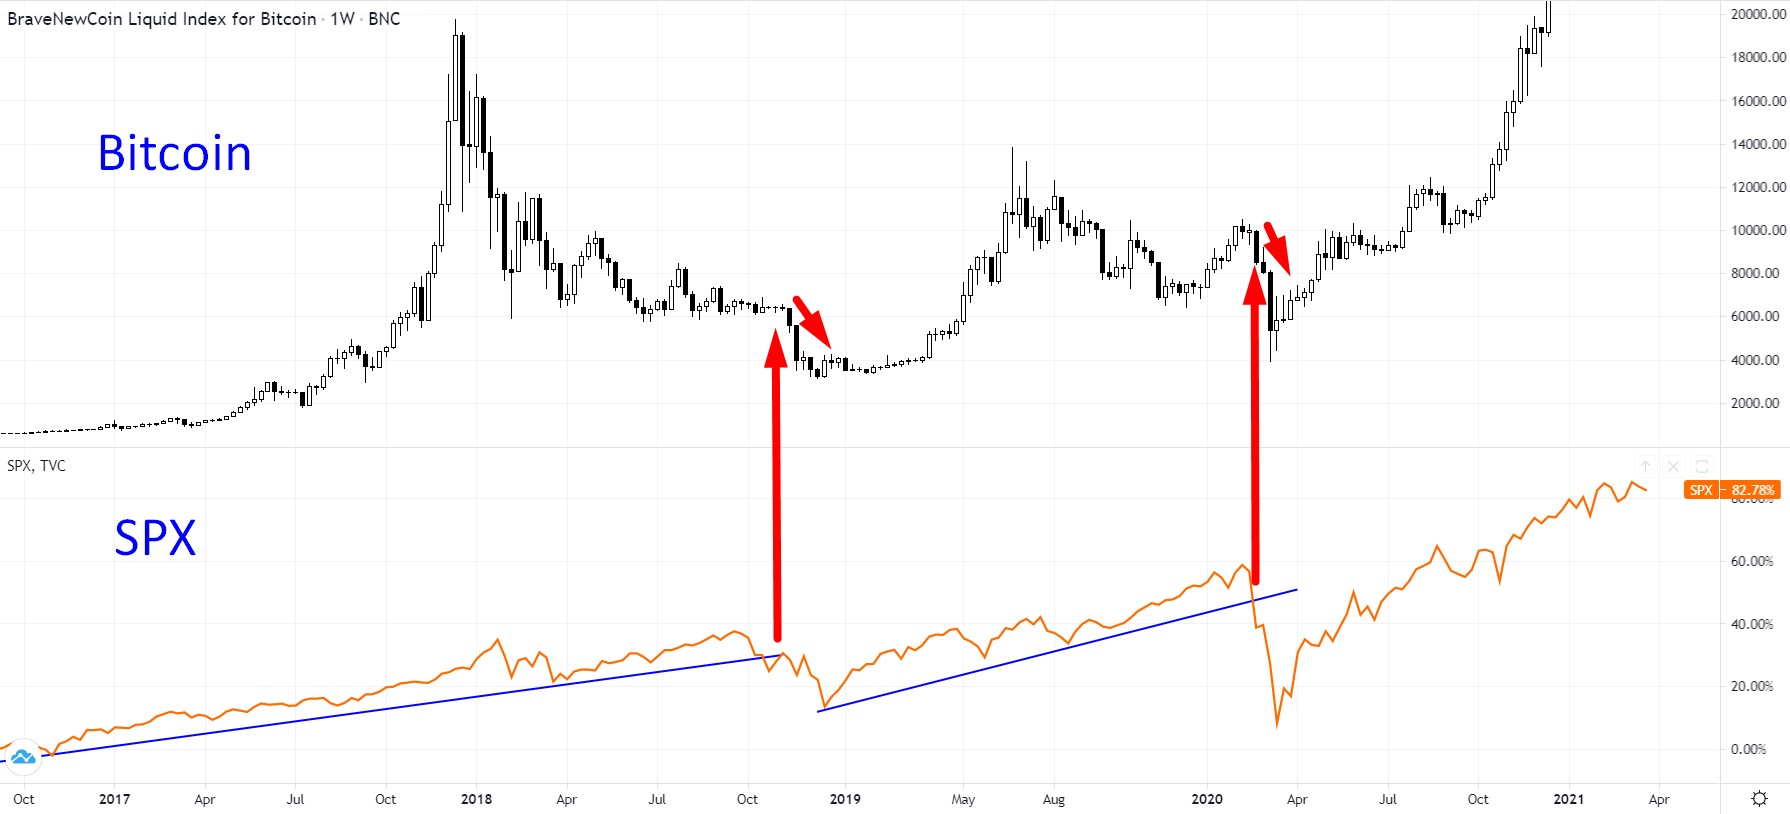
S&P 500
Everyday I check the S&P 500 (SPX) chart. There is a lot of correlation between the bitcoin and S&P 500 markets. Especially when the S&P 500 moves are bearish, and even more so when those moves are strong, for example when it breaks a major trendline on the larger timeframes:
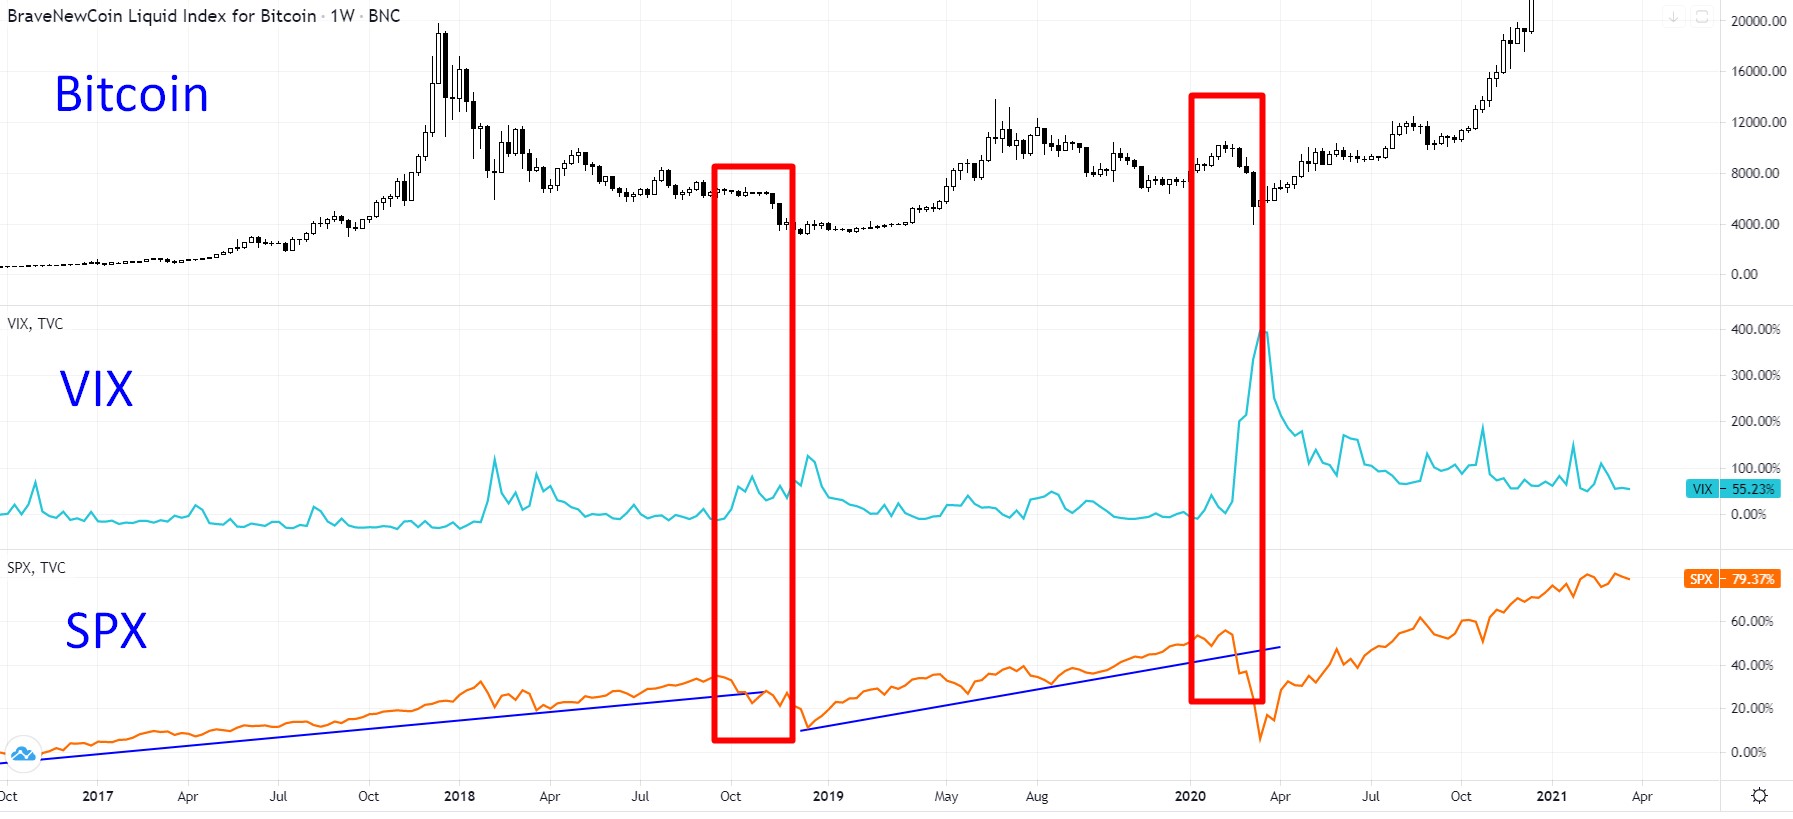
VIX index
That’s really all there is to the SPX-Bitcoin correlation. It’s obvious, and you should keep an eye on it. You can even set an alert for it on Tradingview. I like to use the VIX index for this. The VIX index is an index based on the volatility of the S&P 500. So when the S&P 500 makes a strong move down, then the VIX shoots up, and I get an alert.
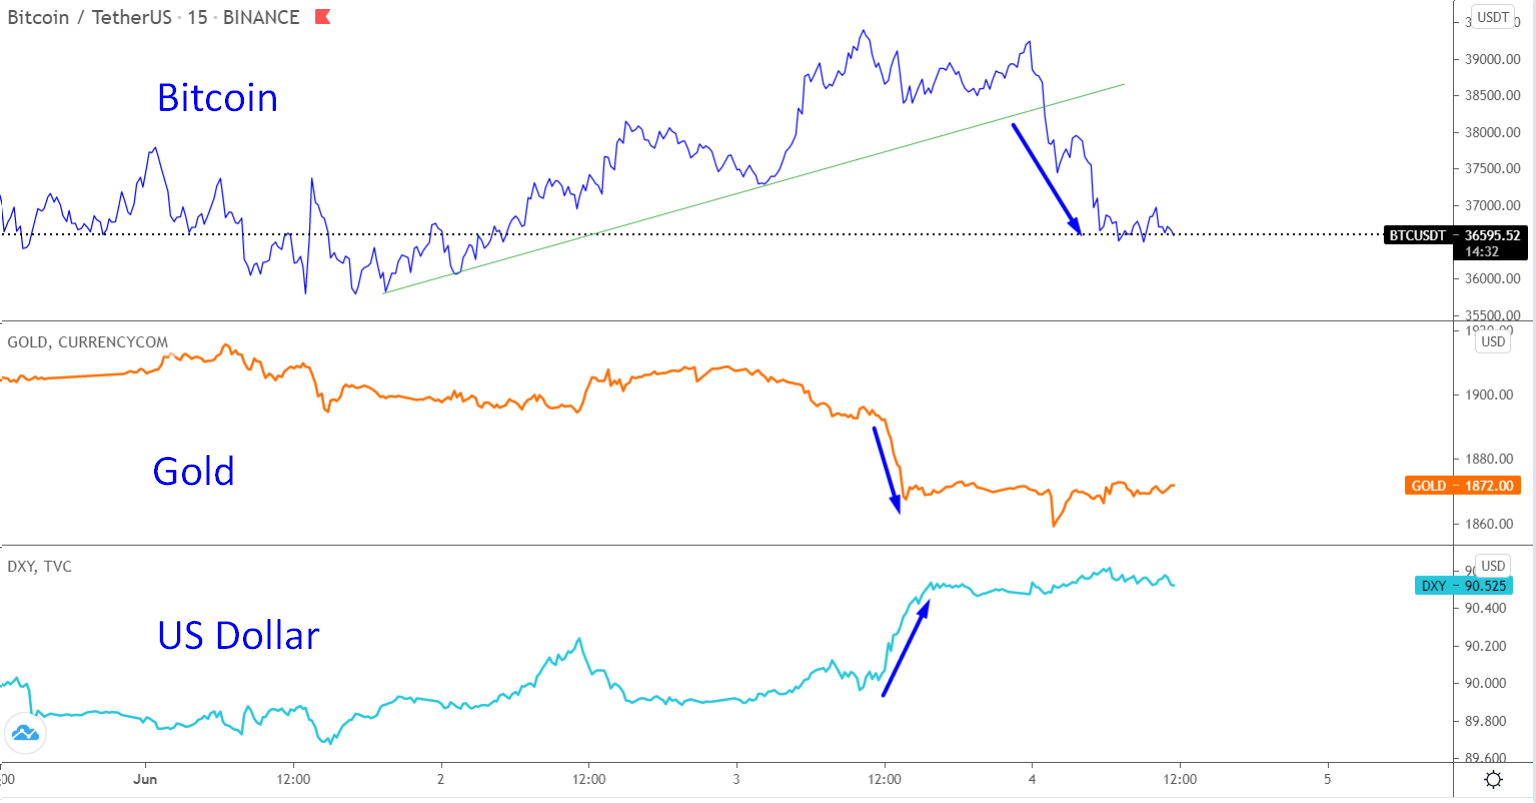
US Dollar and Gold
Bitcoin is considered a hedge against the traditional economy, and especially the US Dollar. And as such it often behaves in unison with Gold, a traditional hedge against the US Dollar.
I constantly check the Dollar (DXY) and Gold for big moves.
Bitcoin is negatively correlated with the US Dollar, and positively correlated to Gold.
This chart illustrates how these correlate:
CME gaps
The CME gap is the difference between the trading price of CME’s Bitcoin futures contracts when the market opens on Sunday, and when it closes on Friday. Unlike cryptocurrencies, traditional assets do not trade 24/7 around the clock. Most traditional exchanges follow normal working hours and close on holidays, and the CME is no exception to this.
Bitcoin CME gaps have often been known to “fill”. Filling means that the spot price moves back to the previous close to “fill the gap” in the CME chart. This is no exact science, the market can literally do whatever it wants. But over the past years there has been a pattern where the Bitcoin spot price has often closed this CME gap. Sometimes even after a long period of time:
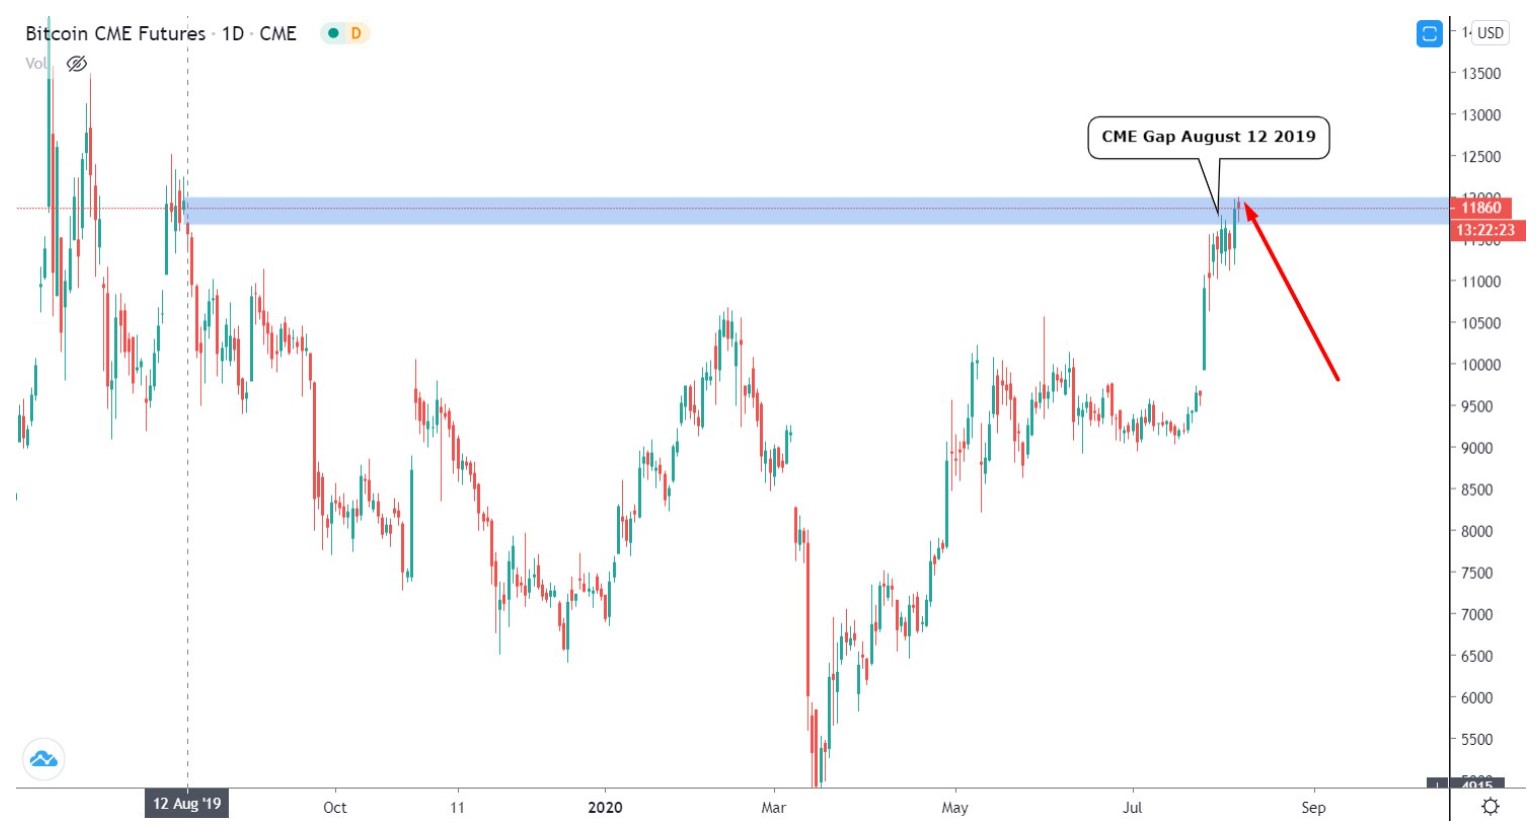
Just remember to regularly look for these gaps on the CME chart and keep in mind that Bitcoin has a tendency to close them.
On Chain Analysis
I like to use Crypto Quant. This is a dashboard that gives crypto traders access to on-chain data in real time. On-Chain data is the backbone for both measuring the long term fundamental value of Bitcoin (network data) as well as monitoring potential risks.
I like to keep it simple and always keep an eye on large BTC inflows on major exchanges and significant miner outflows.
So when large amounts of BTC are deposited to exchanges this is a bearish signal. People send their BTC’s to exchanges to sell them. And when the exchange inflows/ reserves are low, then they’re hodl’ing their coins, a bullish sentiment.
It’s also a good idea to keep an eye on the blockchain, to see what miners are doing.
- Money flow of BTC transferred to and from exchange wallets to evaluate investors’ behavior:
https://cryptoquant.com/overview/btc-exchange-flows
- Money flow of BTC transferred to and from affiliated miners’ wallets to evaluate supply circumstances:
https://cryptoquant.com/overview/btc-miner-flows
Bitcoin – Altcoins Correlation
When I was still new to trading crypto, I ran into problems, despite following all of the 6 previous steps meticulously. Like all crypto traders, I soon found out that Bitcoin’s price movement affects altcoin prices. The relationship isn’t always predictable, but there are some common trends. Bitcoin is the main currency used in cryptocurrency market.
- So when Bitcoin makes a run-up, people sell their altcoins for it.
- And when altcoins make a run-up, people sell their bitcoins for them.
Altcoins and Bitcoin prices are intrinsically tied because in most exchanges, the biggest trading pairs are of the form altcoin/BTC. What this means is that in order to BUY some altcoin you have to SELL some Bitcoin and vice versa. So obviously Bitcoin effects the altcoin prices. Because of this Bitcoin and altcoins often have an inverse relationship:
When Bitcoin goes up the alts go down, and vice versa.
This so called “inverse correlation” is especially true when the total crypto market cap stays the same, and there’s no flow of new money into the market. Then Bitcoin and the alts have to fight for the same money.
But if new money flows into or out of the market, then Bitcoin and alts prices are more often directly related: a “linear correlation”, and more often move in the same direction. But not exactly the same, they seem to be most correlated when the market is bearish. So when money flows out of the market, then Bitcoin and alts drop in the same direction. And when new money flows into the market, then Bitcoin tends to move a bit more than the alts (there is a preference to buy Bitcoin, probably because it is easier to buy Bitcoin with your “fiat” money), but they still move in the same direction.
Data collected by Sifr shows that the coins in its index (including ETH, XRP, and LTC) moved more in linear correlation with Bitcoin over the past year (Aug. 2017 – Aug. 2018). This linear correlation has increased greatly. Although the market experienced its largest increases from August until December 2017, there were significant corrections in the first two months of 2018. With the total market plunging with $500bn by early February. The linear correlation is higher during bearish markets and lower when the market is bullish. The linear correlation between Bitcoin and altcoins subsided throughout July and early August when Bitcoin was bullish and its price went from around $6500 to nearly $8400.
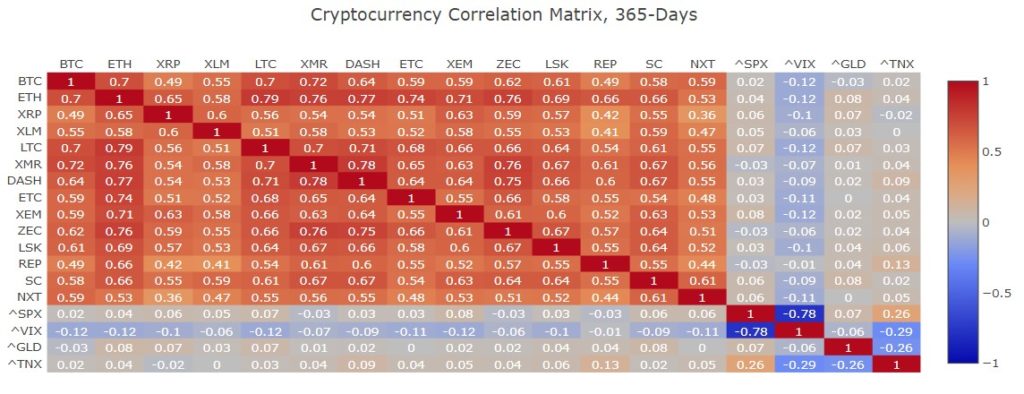
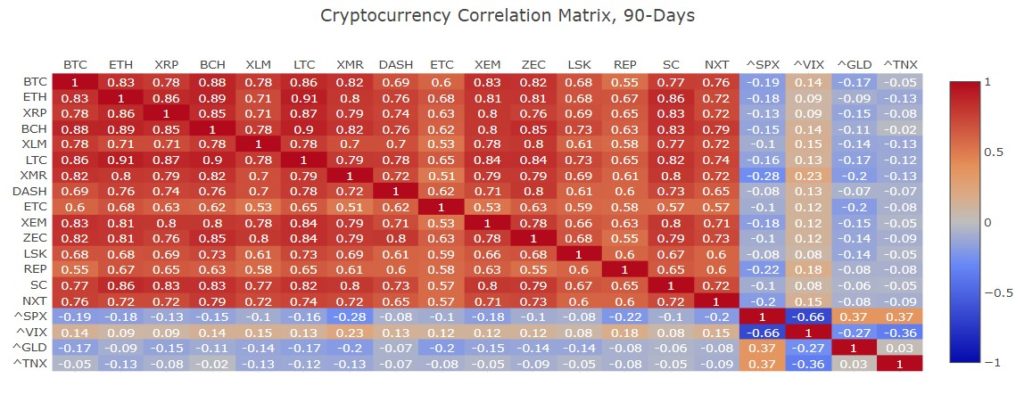
As you see most coin-pairs are more dark red in those last 90 days, as compared to the last 365 days, which means that their linear correlation has increased greatly.
Before I make a trade I usually compare my coin to Bitcoin on a larger timeframe, to see if they are positively or negatively correlated. Is their price action synchronous or opposite? Or totally uncorrelated? So I know what I can expect when Bitcoin makes a move. Comparing coins is btw a standard function in Tradingview.
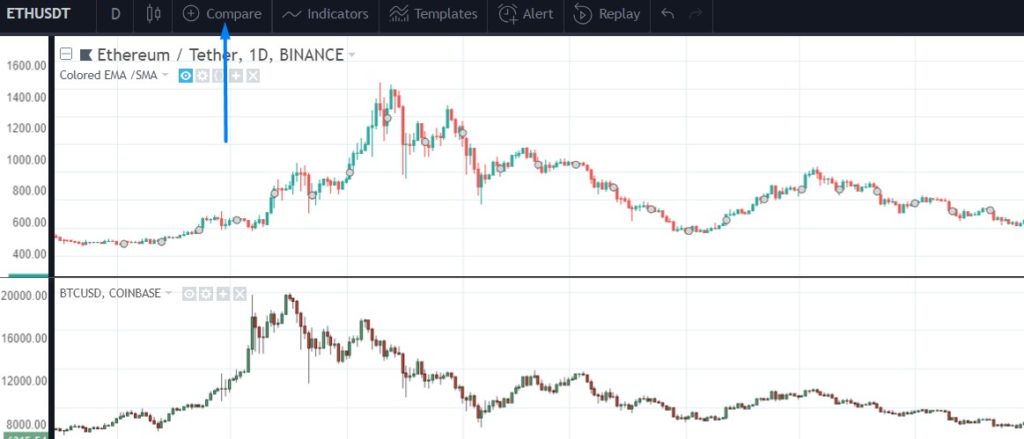
This comparison of ETH and BTC shows they are positively correlated.
Below you see a comparison between BTC and OMG at the end of 2017, that clearly shows a negative correlation or “inverse relationship” (within the blue rectangles).
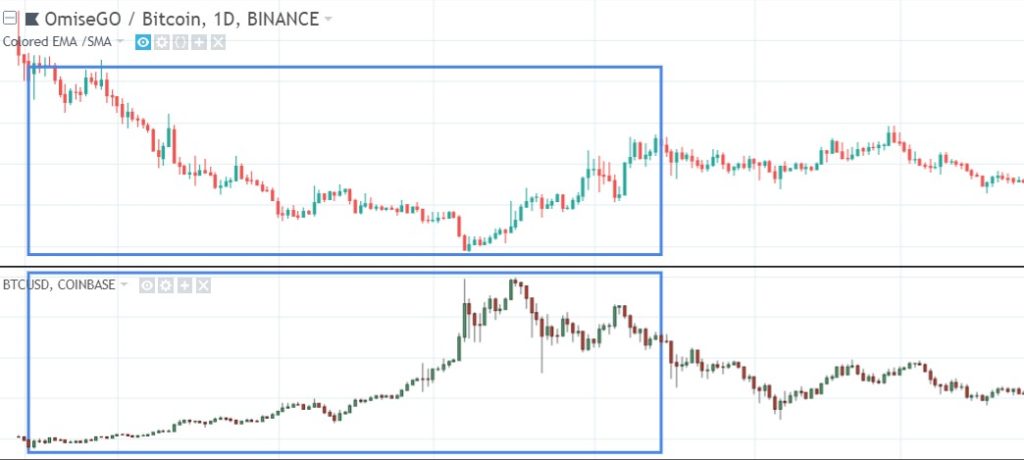
In 2018 (outside the blue rectangles) their movements were more linear correlated. As said we see these inverse relationships less these days.
My Experience:
- When the total market is staying the same, Bitcoin and altcoins fight for the same dollar. So their prices show an “inverse correlation” (often slow movement, nothing special happens). I see this kind of correlation less these days. Over the past years the coins seem to be moving more in linear correlation than before.
- When total market cap does increase, new money flows in, and Bitcoin often takes the money and turns bullish, leaving the alts going sideways. But when Bitcoin goes up really quickly, alts can go up along with it. Often caused by good news, fomo etc.
- When total market cap shrinks, as money flows out of the market, Bitcoin and the alts show a “linear correlation” as they both turn bearish (sometimes quick panic, sometimes slow “bleed”).
My Conclusion:
As I have experienced, over the past years the coins seem to be moving more in linear correlation than before. When market cap increases often the worst that can happen is alts going sideways, while Bitcoin goes up.
When the market cap decreases I am most sure alts will go down along with Bitcoin.
So my conclusion is that these days I am most scared when Bitcoin goes down, because alts often go down too, and most of the time they go down more.
My Strategy:
When I want to buy an alt, and all my previous 6 steps give me a go, then as a 7th step I will next take a look at Bitcoin to determine what it is likely going to do. For this I repeat the 1st 6 steps I did to evaluate my trade, but this time to evaluate Bitcoin itself.
To show you the importance of the Bitcoin correlation, and why you should always look at Bitcoin before entering a trade, take a look at the next example.
IOTA made a nice breakout, showing bullishness and strong momentum, it was the first retrace in an uptrend, actually my favorite trade setup, a reverse-to-mean setup, where price is below an upsloping SMA50:

As you can see price even made a couple of pullbacks to the SMA50 already.
Nice? No!
At the exact same time Bitcoin also broke below an important support zone (blue line), making a lower low! Next RSI crossed below 40, and as we know RSI 40 acts as a support in an uptrend. So the Bitcoin uptrend was no longer confirmed by the RSI:

Traders who wouldn’t look at Bitcoin would be surprised. Because this is what happened to IOTA next:

So I want to know what bitcoin is doing, at the exact moment I timed my entry in the other coin. If :
- Bitcoin’s RSI is sloping down, and is below 40, or
- Bitcoin’s SMA50 is sloping down, or
- Bitcoin’s Stochastic is at the top ready to reverse to the next downcycle (“correction wave” or “retrace”), or
- Bitcoin is below a major resistance level
Then it is a signal to cancel your entry.
So this 7th step works the same way as the earlier 6 steps: the more steps confirm Bitcoin is bullish, the higher the probability your trade will work out good.
Each step along the way has the power to VETO the entire trade.
B.t.w. It is very important to know the technical structures in the Bitcoin chart on a higher timeframe. A quick look at Bitcoin on a daily chart can easily show you the most obvious structures:
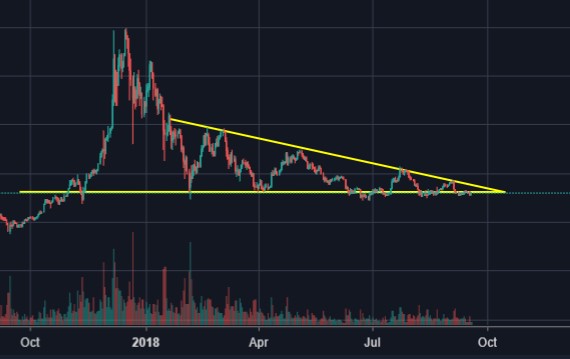
Always know where Bitcoins price is in relation to these big scale structures, take a helicopter view to put it into context, so you won’t be surprised when Bitcoin takes a turn.
Also keep in mind that Bitcoin can behave differently around Future expiration dates. I put them in my calendar and 2 to 3 days before these dates I am a little bit more cautious. The Bitcoin futures expiration dates are:
- the 4th Friday of the month (CME future)
When trading is a serious profession for you, these are good things to look at, maybe a good morning-ritual: take 10 minutes to look at the bigger scale market structure and read the daily crypto news.

So before I make a trade, and have gone through the 6 previous steps successfully, I take the last but not least important 7th step: I repeat all previous 6 steps for Bitcoin. I don’t enter my trade unless I have made all the 7 necessary steps to make the right trade decision. Not good? Just wait for the next opportunity.
You have now set your 7th step towards making high probability trades. You have learned what information you need in order to make a balanced trading decision.
In the next chapter I will show you real-world examples. And remember: Never skip a step, or you might fall.
Keep it simple!
Click on the next button to go to chapter 8: Bringing it all together