I saved the best for last! In this Bonus chapter I will give you an in-depth look inside my favorite trade setup: the mean-reversion trade. This trading method is like cherry picking, only trading the setups with the highest probability. But before digging deeper into the trading method itself, I will first focus on the statistical phenomenon behind it.
Another word for mean is normal. What is normal? I focus on what is normal, in order to find what is abnormal. I am looking for extremes, for irrational price behaviour.
The statistical phenomenon I am referring to is the “reversion to the mean”.
This is about price moving away from averages at highs and lows, but eventually returning to the mean again.
Most of the time a coin moves within a particular range, be it up, down, or sideways.
When price is normally distributed within this range, then you can expect deviations to reverse back to the average. As you also see this in the statistical concept of the normal distribution. At the middle of this bell shaped curve you’ll get the highest probability. At the edges you get the lowest probabilities.
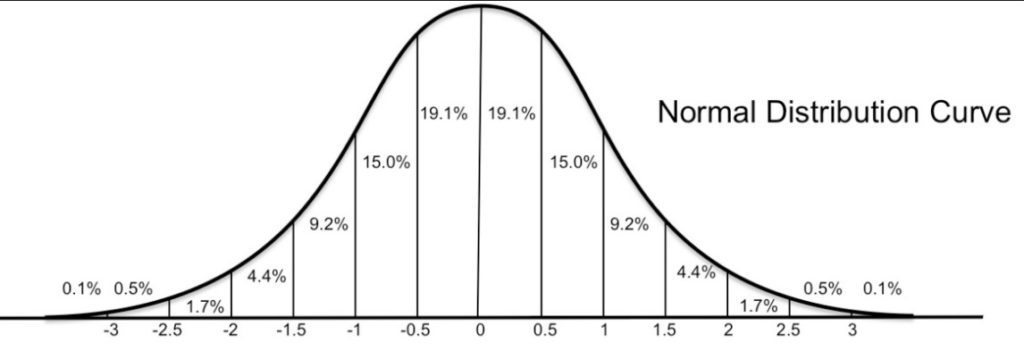
The “normal” is that part of the measured data that occurs the most frequently.
On a price chart this means we have an average price, and price deviating above or below it. In uptrends it deviates more to the upside of the average, and in a downtrend more to the downside.
Crypto markets (and many other markets) aren’t really normally distributed.
Although it looks like that often. Price can deviate far more from the mean, than a statistical “standard deviation”. The market can really do anything, at any time, always keep that in mind.
But by filtering mean-reversion setups for strong and early trending markets
you actually get very high probability trading opportunities.
It is my favourite trade!
How do you trade this deviation from the mean?
When price deviates from the mean, we have an opportunity to trade the reversion-to-the-mean. To trade such a mean-reversion, we need to know the average price over a previous period. How do you know the average in an up- or downtrend ? By using the right moving average.
Using Technical Analysis you want to determine :
- Is this coin trending?
- Is it a strong trend?
- Is it still an early trend?
All this can be deduced by using the right moving average.
As you know I use the 50 period SMA (SMA50).
SMA50
As you have learned, when going long you have the highest probability in an uptrending market: an upsloping SMA50, and when going short you have the highest probabilities in a downtrending market: an downsloping SMA50.
These reversion-to-the-mean trades, also called “mean reversion”, are my highest probability trades. These are the trades I love the most.
They are often compared to a rubber band, as the price is stretched away from its average and then snaps back to it.

So the general idea is to buy when price deviates to the downside, and sell when it deviates to the upside.
My mean-reversion method basics:
- Always trade towards the mean: buy below the SMA50, short above the SMA50.
- Only buy in uptrend, only short in downtrend.
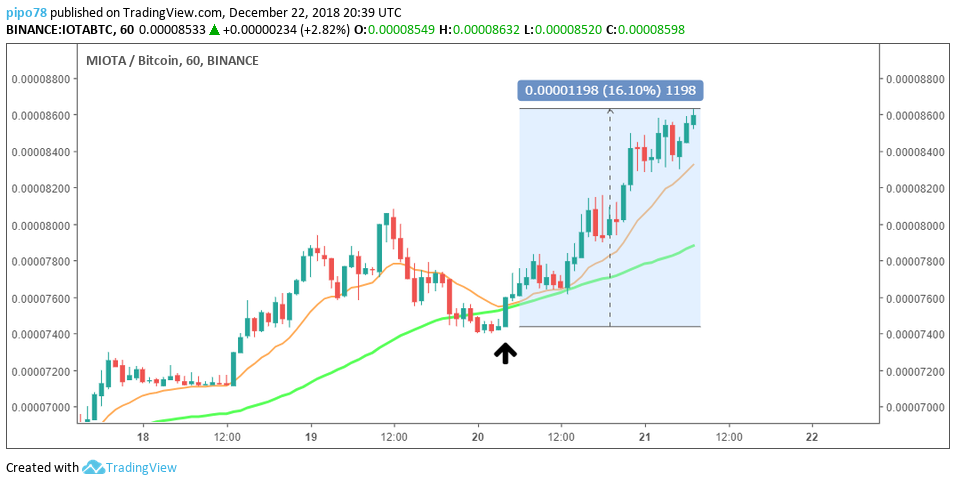
In the next chart example, the red bar is like stretching the rubber band, the green bar is like firing it, as if the rubber band snapped back up tot the mean:
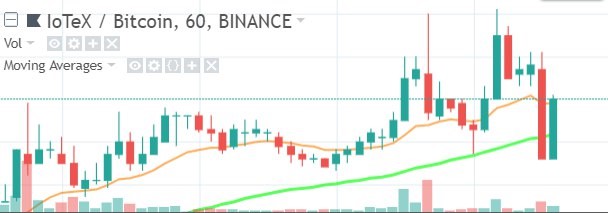
(the green line is the SMA50, the orange line is the EMA15)
To summarize these setups in practical terms: when going long you have a higher probability when you buy below the SMA50, when going short you have a higher probability when price is above the SMA50. This gives me simple trading rules. When buying a mean-reversion opportunity, you want:
- The SMA50 to be sloping up (a steeper angle means a stronger trend)
- Price to be below this moving average (often a fast drop below the mean, mean a fast bounce back to it, and a slow drop means a slow return)
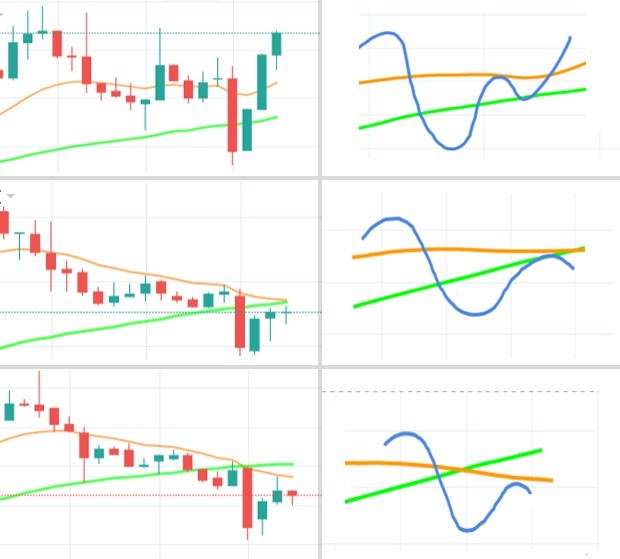
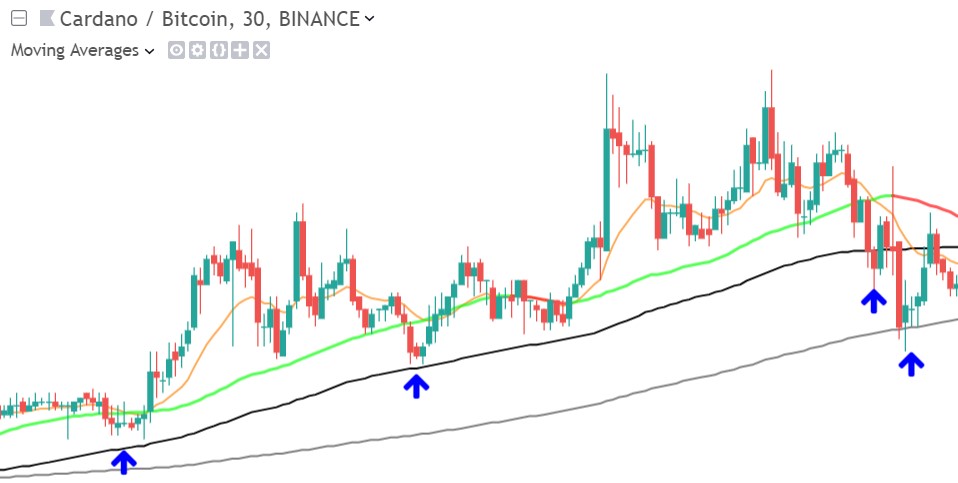
It is very important that these conditions are still met at the moment of entry:
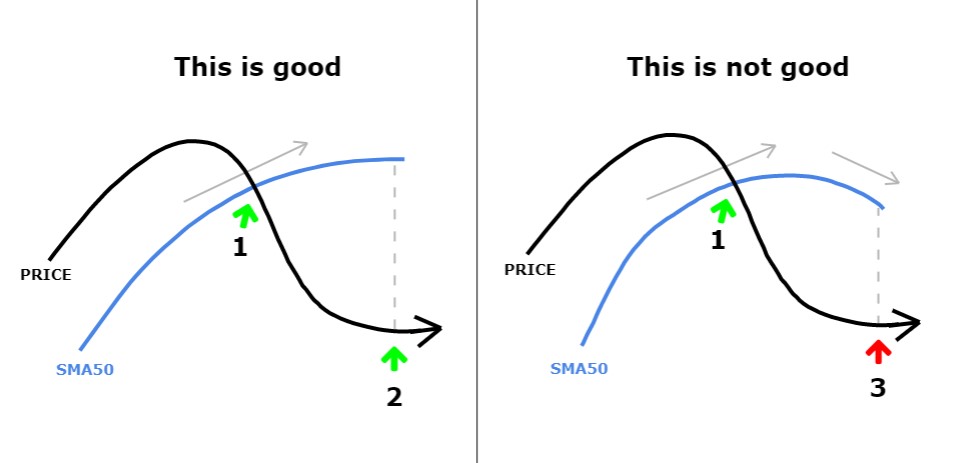
^^ THIS IS PROBABLY THE MOST IMPORTANT IMAGE IN THE ENTIRE COURSE ^^
- Left example price drops below an upsloping SMA50 (1), and next at the bottom of the retracement the SMA is still sloping upwards (2). That’s a perfect mean- reversion setup!
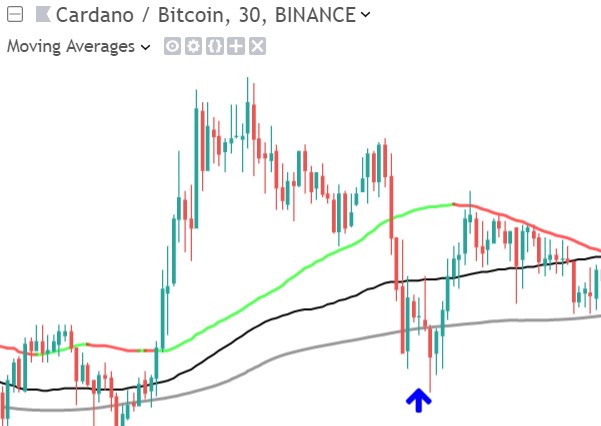
- BUT in the example on the right, you can see that by the time the retracement has come to an end (3) the SMA is already sloping downwards. This is a bad mean reversion setup you should avoid.
So that the SMA50 is still sloping upwards at the moment of entry is of the essence!!
I determine the timing of the entry in the same way as before, using my 7-step system. I first look for Stochastic to reverse up, preferably crossing the 20-line and next I want to see the MACD reversing up. So this is what Stochastic and MACD should look like to confirm an entry:
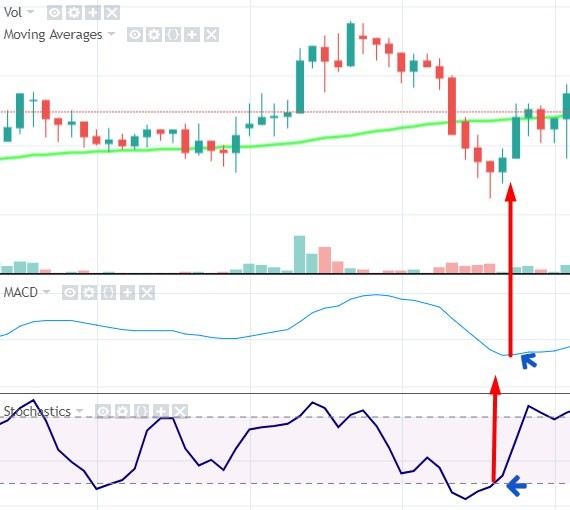
So after Stochastic moves up, I wait for MACD to move up. MACD is a bit more lagging (like all averages) but it often saves us from complex retraces. But remember that sometimes MACD can be a bit too slow:
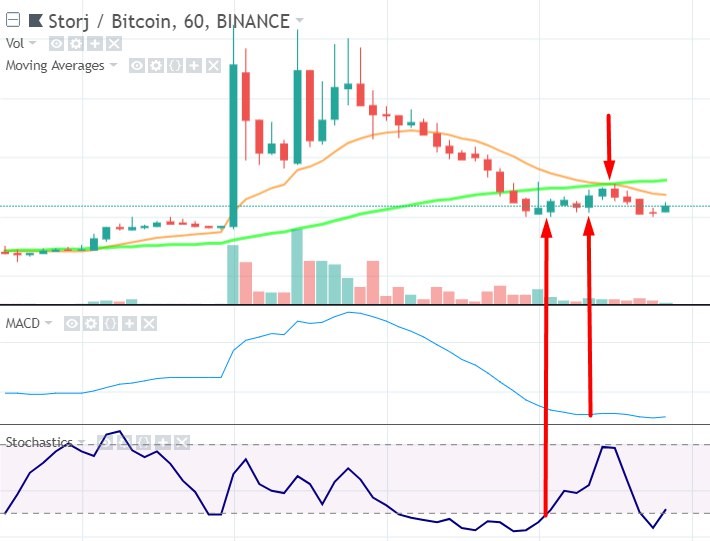
The above chart is also a great example of how the EMA15 (orange line) often acts as resistance, so my rule of thumb is to get out just below the EMA15. I use that as take profit level in 90% of my trades.
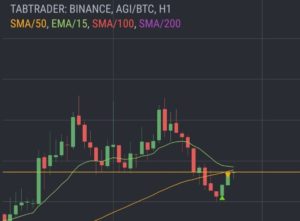
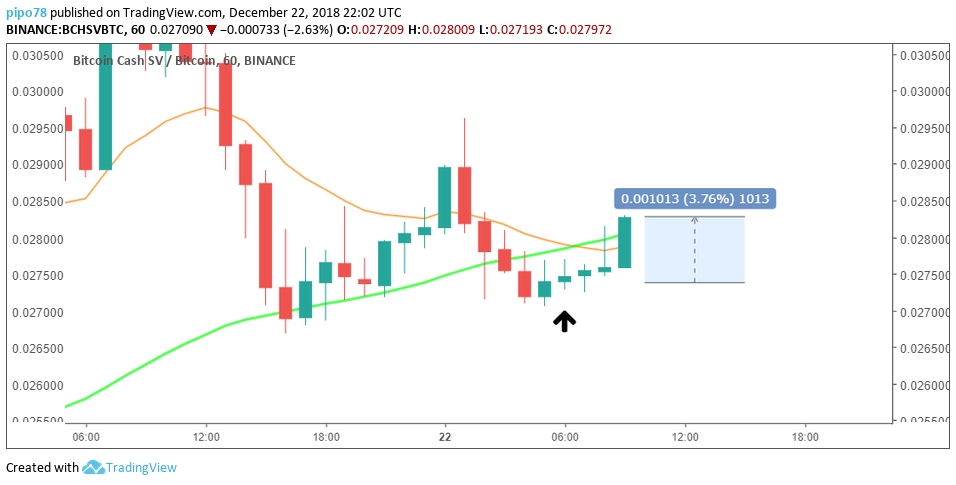
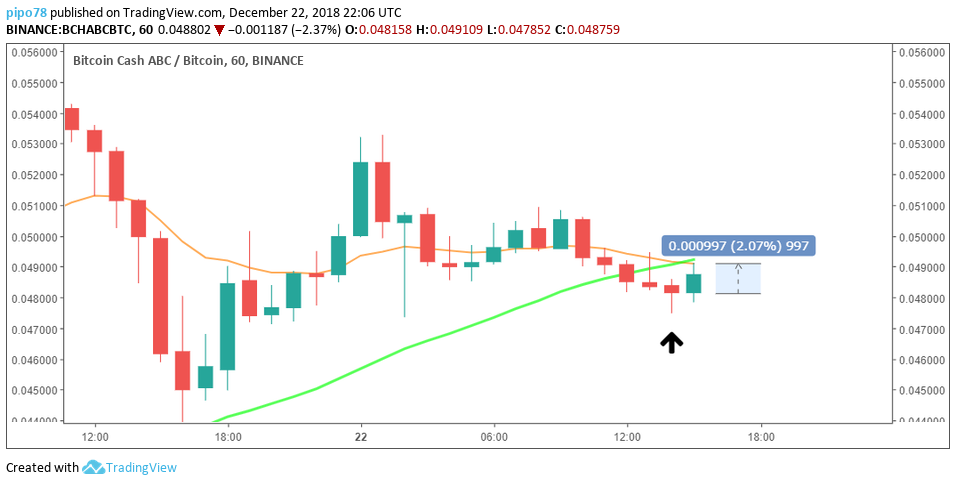
Btw. This is a trade I just made, this is what mean-reversions are all about:
Next to this you also have difference in strength and probability between mean-reversion setups. The best mean-reversion setups often have:
- a fast price drop below the SMA
- a steep SMA slope
Not only the SMA, but also the EMA15 plays a big role in the behaviour of the mean-reversion:
(green line = SMA50, orange line = EMA15)
This lead me to some extra conditions to find the premium mean-reversion opportunities:
- You want a big single red candle drop below the SMA50.
- While the EMA15 is above the SMA50.
- And the SMA50 has a steep upwards angle.
A simple example that meets these new conditions:
When EMA15 is below the SMA50, at the moment you enter, it is a lower probability trade and doesn’t always give you a good bounce. It often bounces to the EMA15:
That’s also the reason I put my TP just below the EMA15 most of the time.
And if it does bounce beyond the EMA15, chances are still high it will remain below the SMA50, as it will more often get exhausted:
Below is a chart where you can compare both these setups. An example of the difference between a higher and lower probability mean-reversion setup.

SMA100 and SMA200
As I have mentioned earlier, next to the SMA50 the SMA100 and SMA200 are also very important. When I am trading mean-reversions on a 1 hour chart with the SMA50, then I also have the SMA100 and SMA200 plotted on the same chart. Always keep this in mind when trading mean-reversion setups on a 1 hour chart:
On a 1h chart, the SMA100 represents the SMA50 of the 2h chart
On a 1h chart, the SMA200 represents the SMA50 of the 4h chart.
Besides that many traders consider the SMA100 and 200 as very important supports and resistances, and always keep an eye on them.
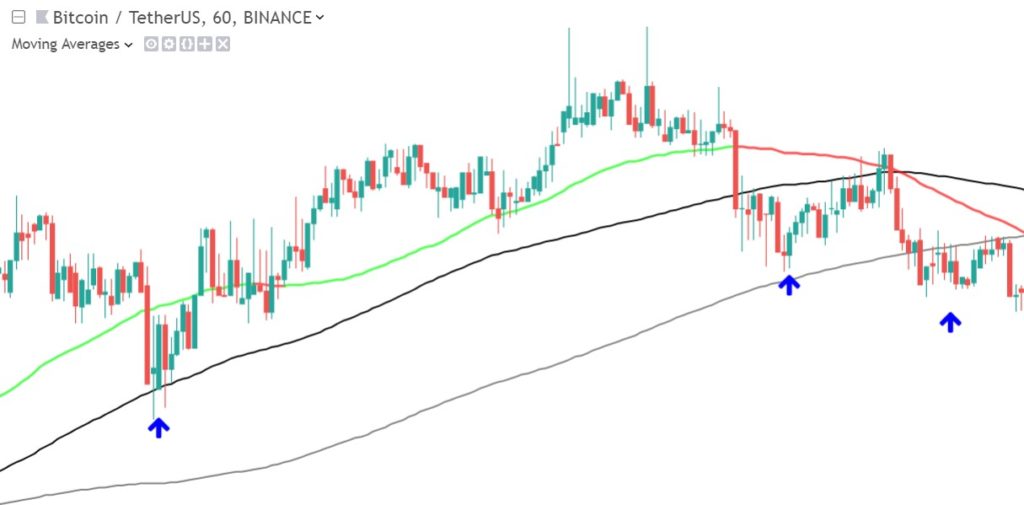
On the next chart example you can see how you can get mean-reversion opportunities on multiple period SMA’s on the same chart.
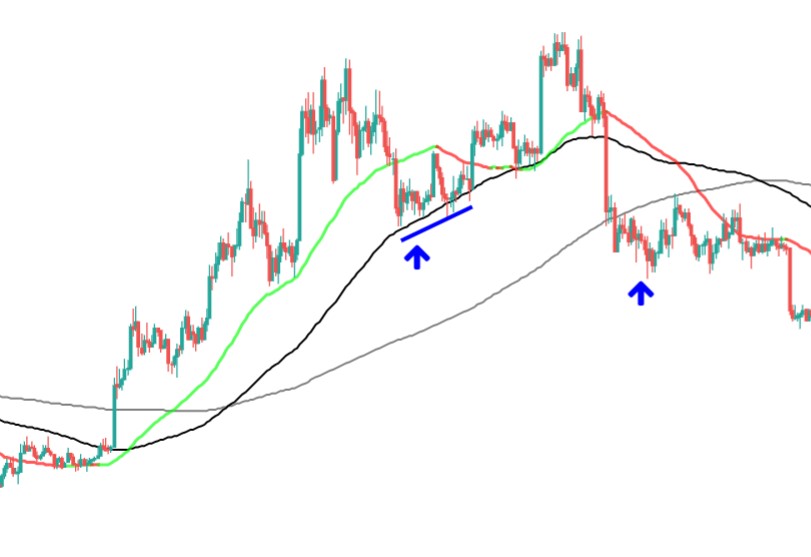
- At the left blue arrow you see price breaking below an upsloping SMA50, a mean-reversion setup. It finds support at the SMA100 level. This is what I see quite often, when price breaks below the SMA50, then the SMA100 is often the next support, and when it breaks below the SMA100, then the SMA200 is often the next support it respects.
- At the second blue arrow, you see that price broke below an upsloping SMA200: This is also a mean reversion setup! Next it neatly returned to the SMA200-mean again.
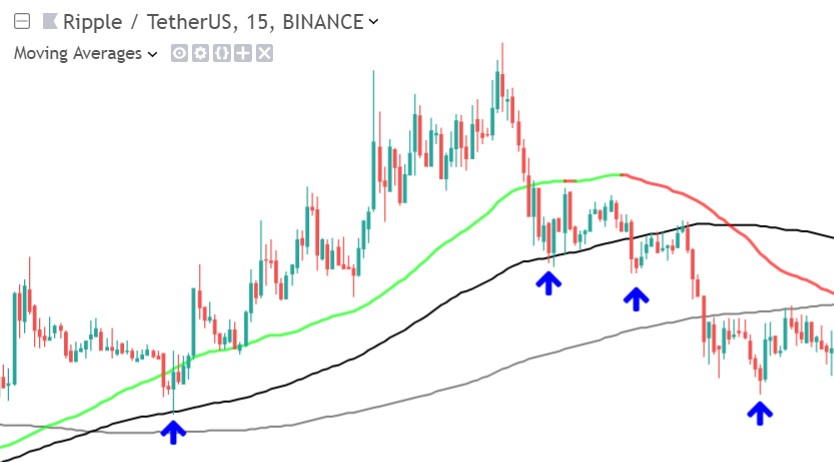
- At the left arrow you see a “normal” mean-reversion, price breaks below an upsloping SMA50, it respects the SMA100 as support.
- The second arrow you see a mean-reversion of the SMA100, and price respected the SMA200 as support. Meanwhile the SMA50 is already sloping down: already later in the trend – upward momentum is losing steam, price didn’t manage to make a higher high.
- At the third arrow we get a mean-reversion setup of the SMA200. Although it still returned to the mean, now the SMA50 AND SMA100 are both sloping down. You can clearly see we got a complex ABC retrace, confirming the end of the trend.
Nice Retracement or dangerous reversal?
One of the most important issues with trading mean-reversion setups, is that the retracement your are using as an entry, could actually turn into a trend reversal.
So the most important question I always ask myself: Is this a retracement or a reversal? I already covered this in chapter 3. But because of its relevance and importance I would like to show you those 2 chart pattern examples again as a reminder:
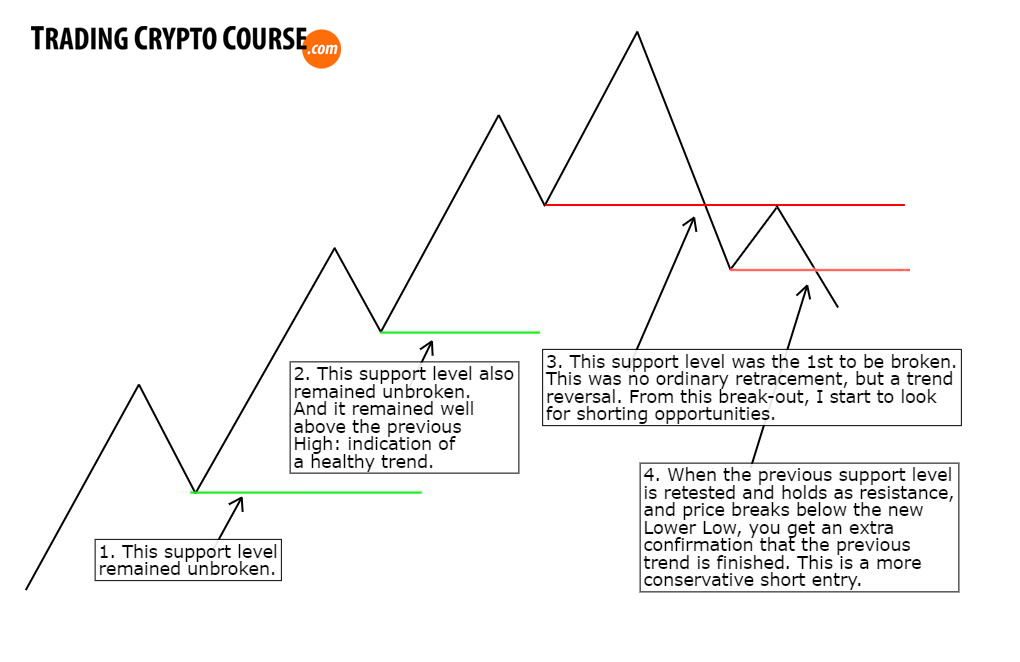
Next I have added a SMA50 (50 period simple moving average) to the same chart. This shows me 2 mean-reversion opportunities. This chart is meant to show you that mean-reversion setups late in a trend are very dangerous, and often result in a trend reversal.
You see that the using only the slope of the SMA50 as indication of the trend can be dangerous if used without proper reading of the structures on the chart.

So the conclusion is that chart patterns are very important when trading mean-reversions. Because when there is a divergence between the slope of the SMA50 and what the structures on the chart tell you, then it could be a reversal instead of a retracement, and a VERY DANGEROUS mean-reversion setup.
But it could be an excellent trend reversal signal: in the above example a perfect short entry. This is why I see mean-reversion trades as being inextricably linked with trend-trading. More about trend-trading in the next chapter.
Final Words
As you probably already have noticed, this trading strategy is an extension of what you have learned in all the previous chapters. So it’s logical I saved it until the end of this course. It is also a perfect setup to combine all the 7 steps in your head in a practical way.
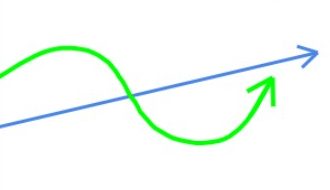
When you are already late in a trend (after 3 waves up), you should be more careful about these mean-reversion setups, as I already mentioned in the previous paragraph. A drop below the SMA50 will more often be in the form of a complex abc retrace. Based on Elliott waves I use this template as how the average trend looks:
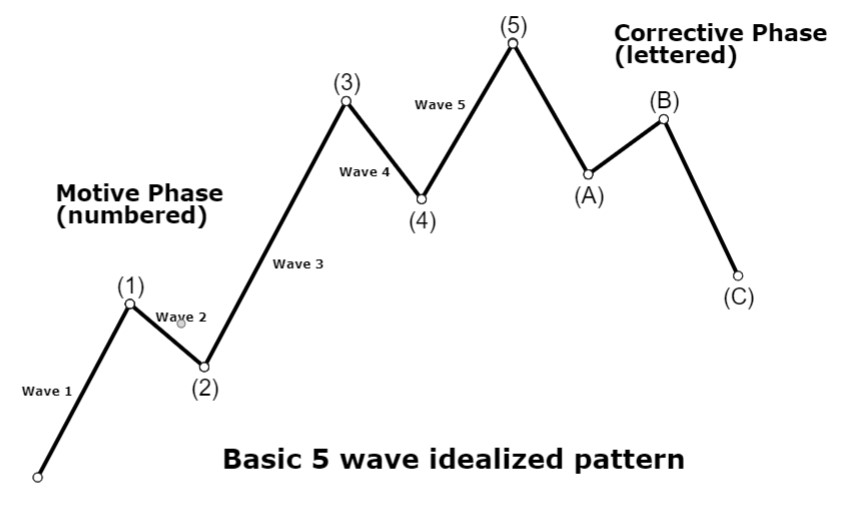
I know I have shown the above image before, but I think it’s very important to get used to this template 🙂
The trend often consists of 3 cycles, after those the probability for trend continuation is lower and retraces will be more often complex abc retraces.
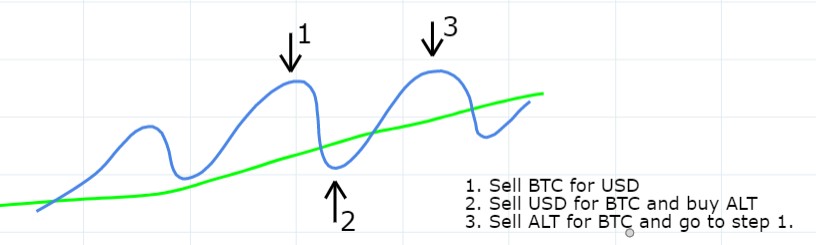
I trade mostly on an 1 hour chart, and for the higher timeframe confirmation of momentum I often use a 4 hour chart. My base currency is BTC, and when the market is down I try to move to USD(T) at highs. People often ask me when do I buy USDT, this image makes this a bit more clear:
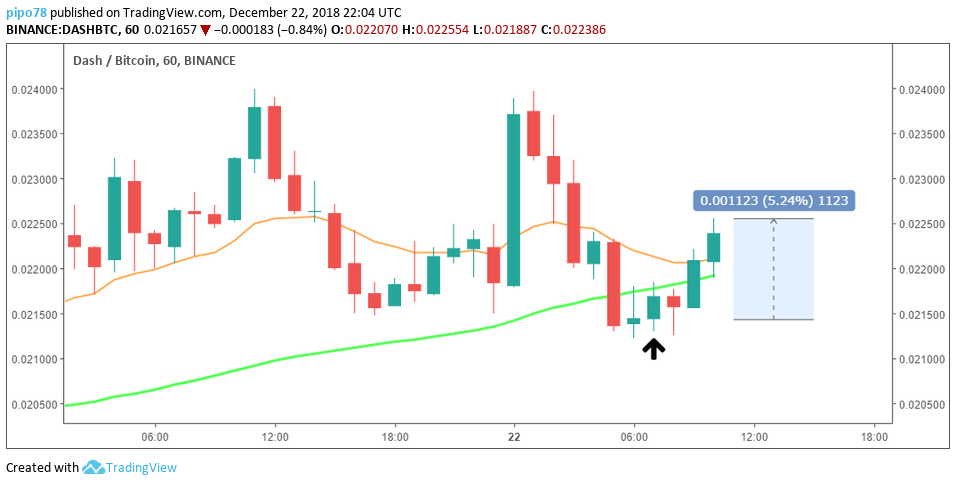
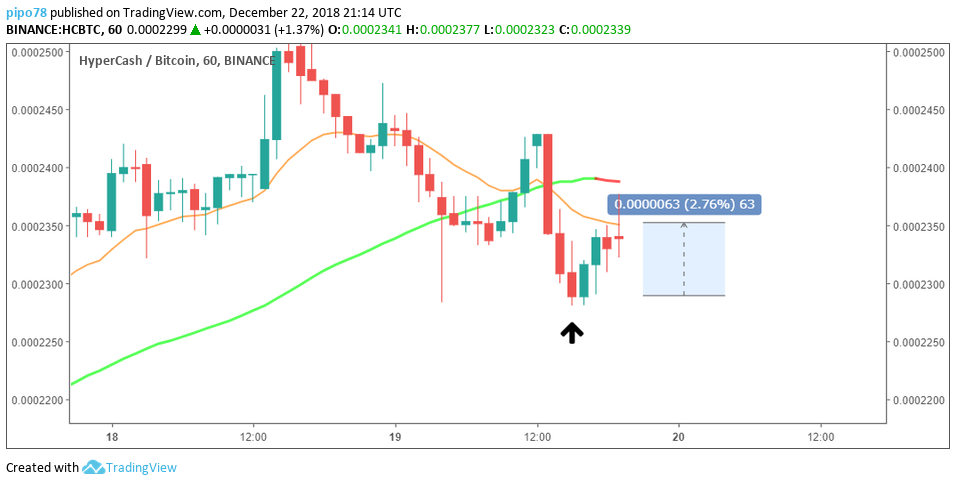
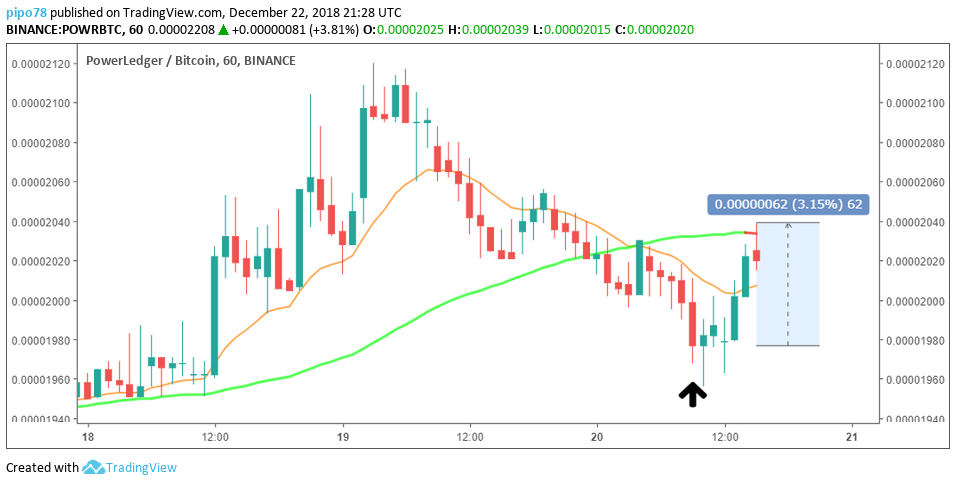
Below some real-world mean-reversion examples:

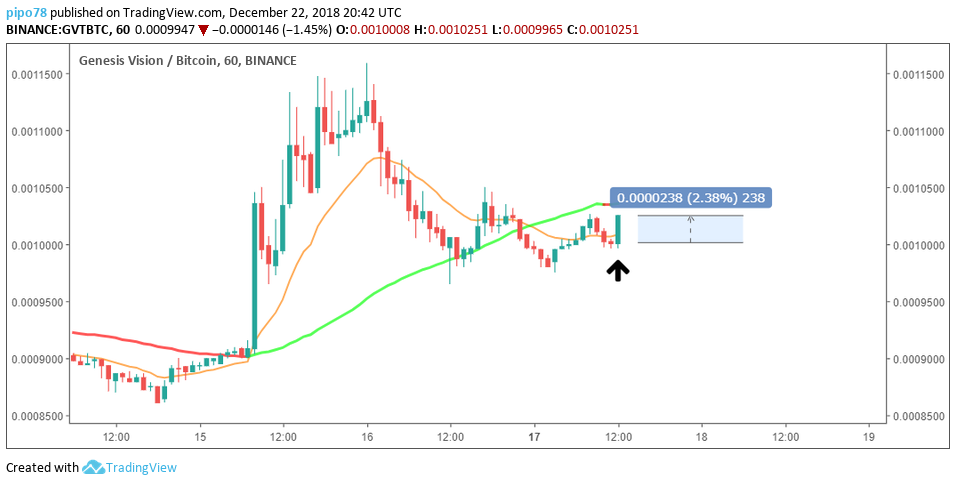
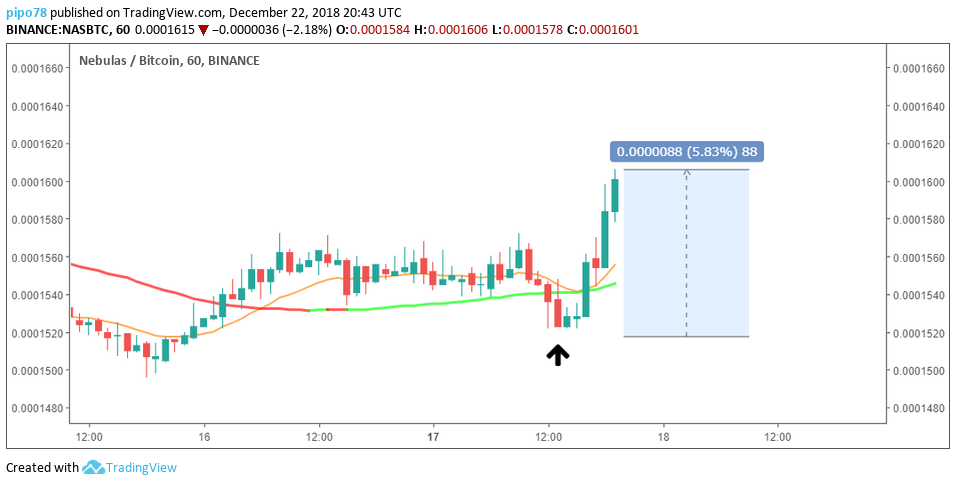
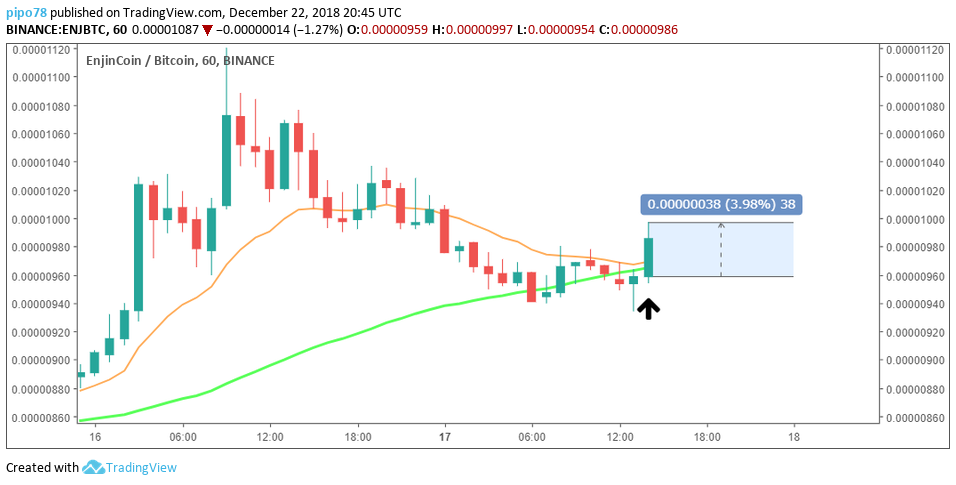


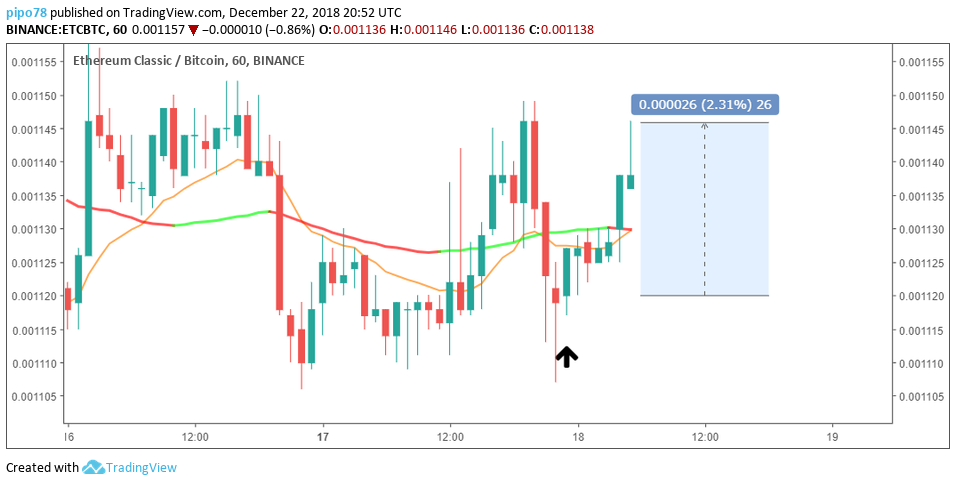
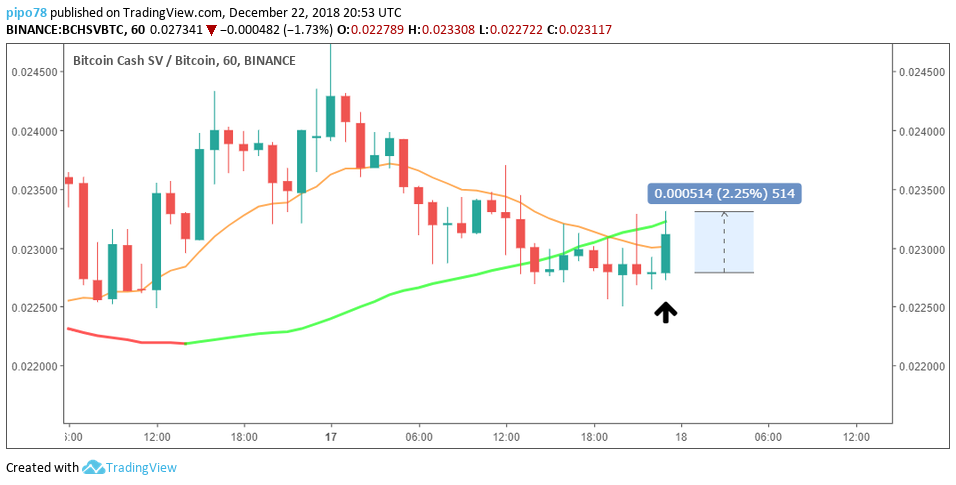
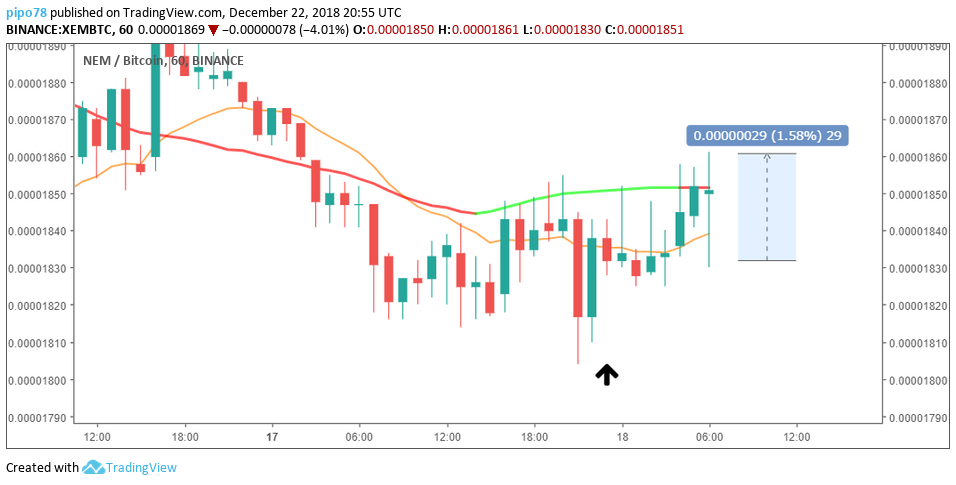
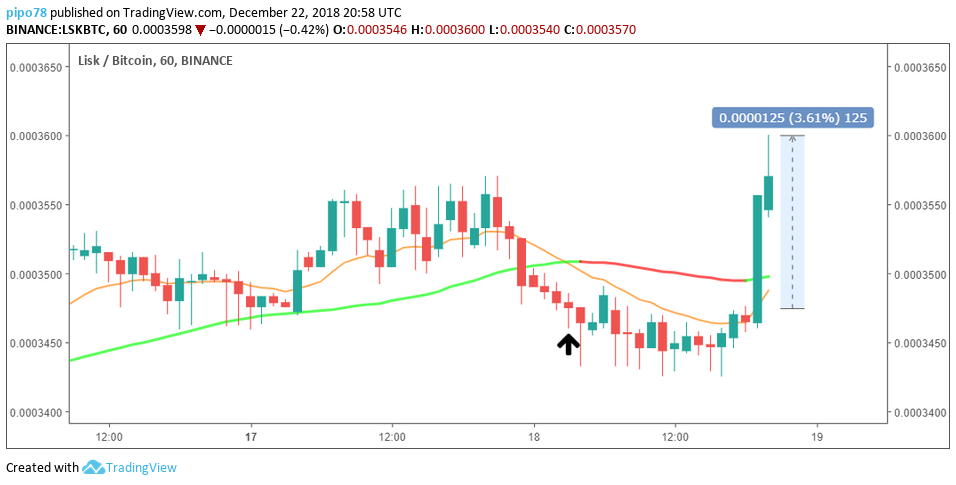
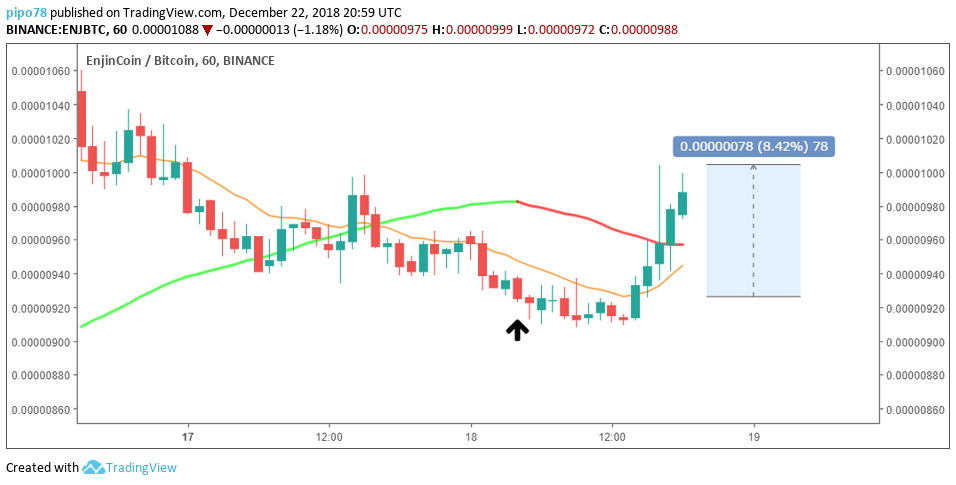
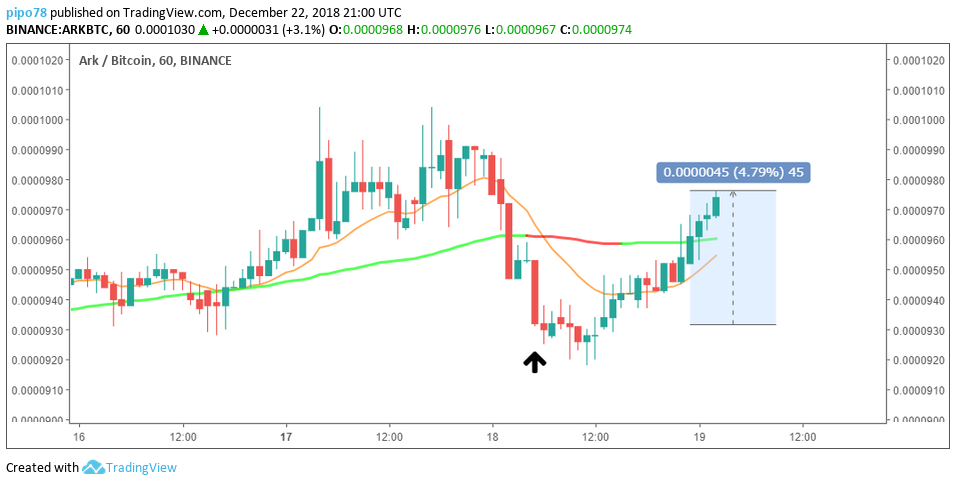
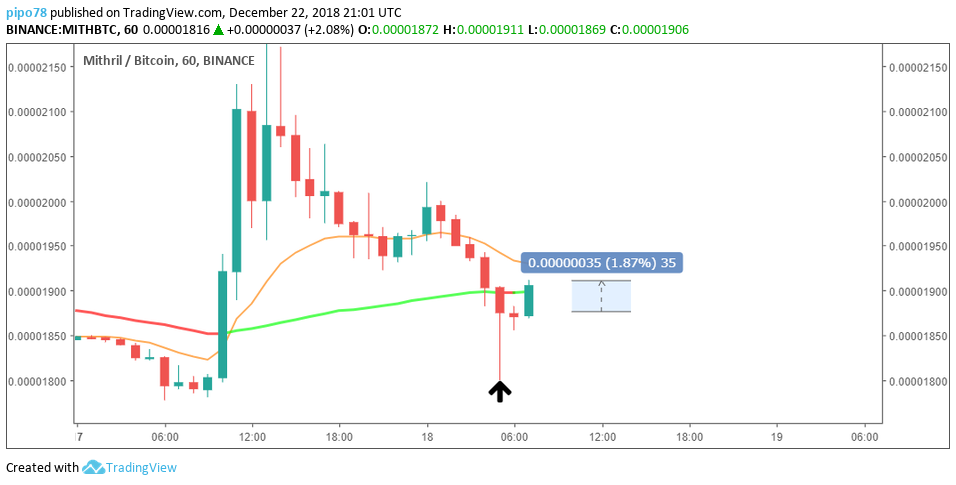
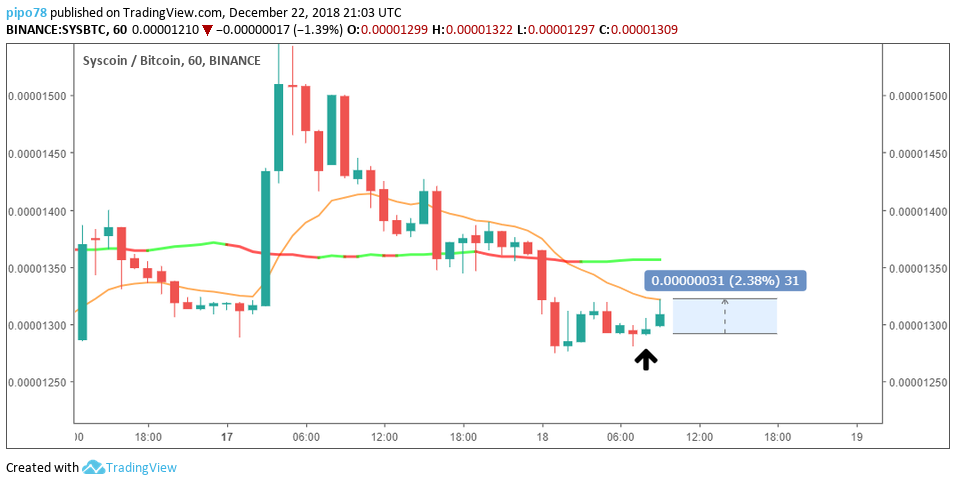

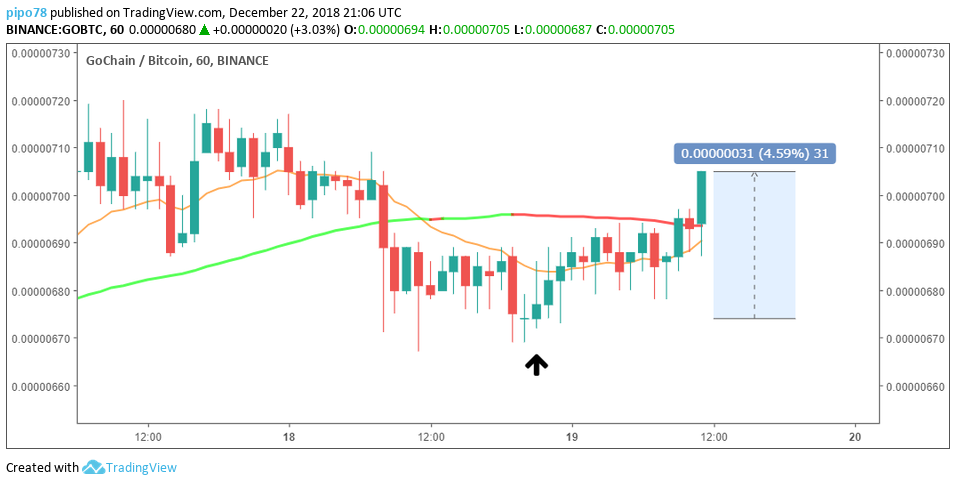
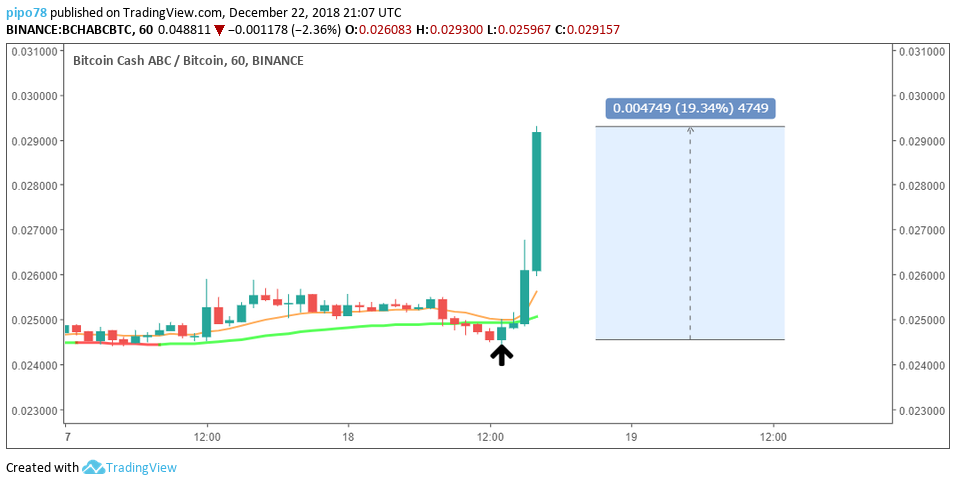
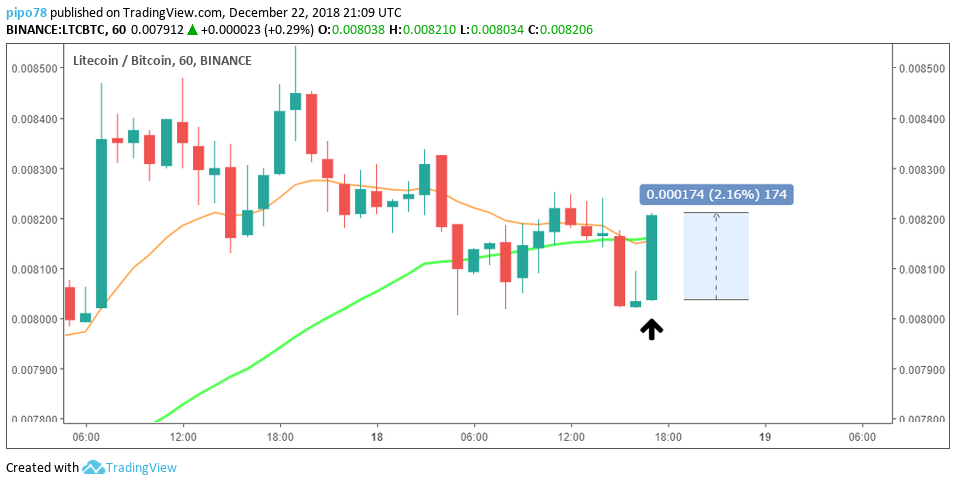

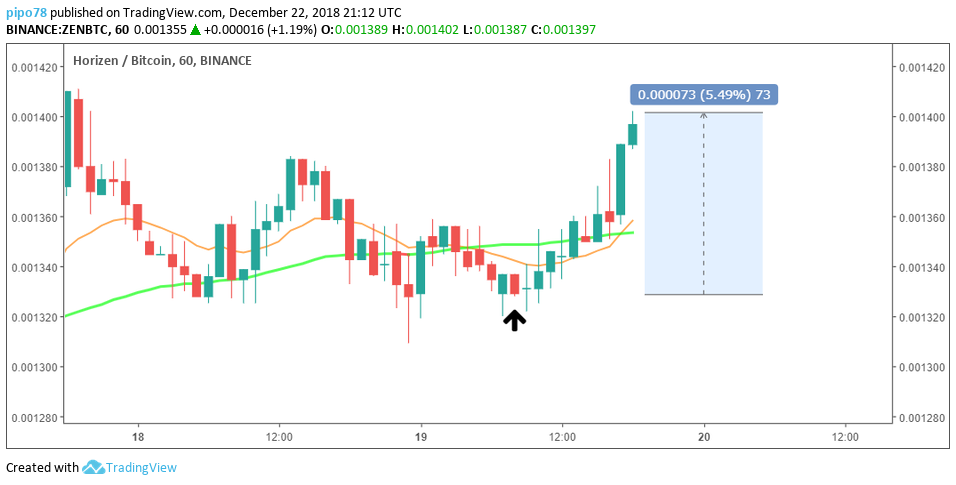
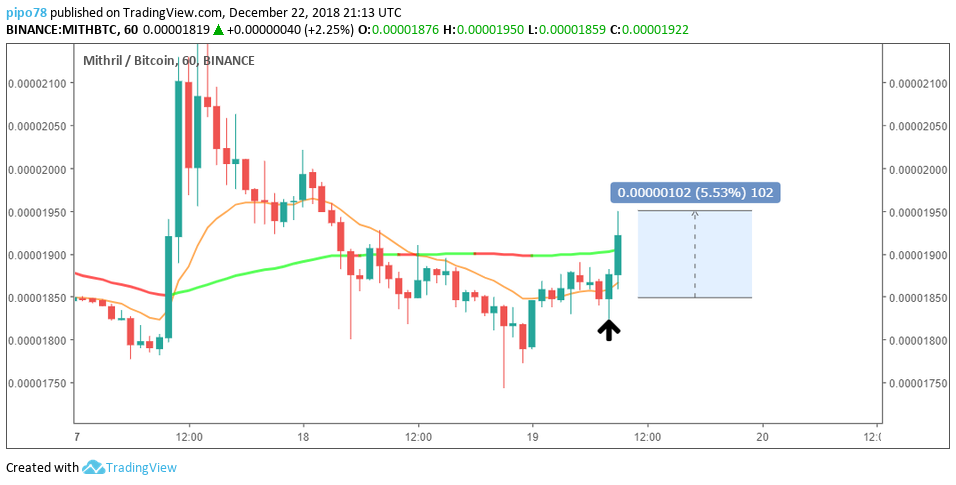
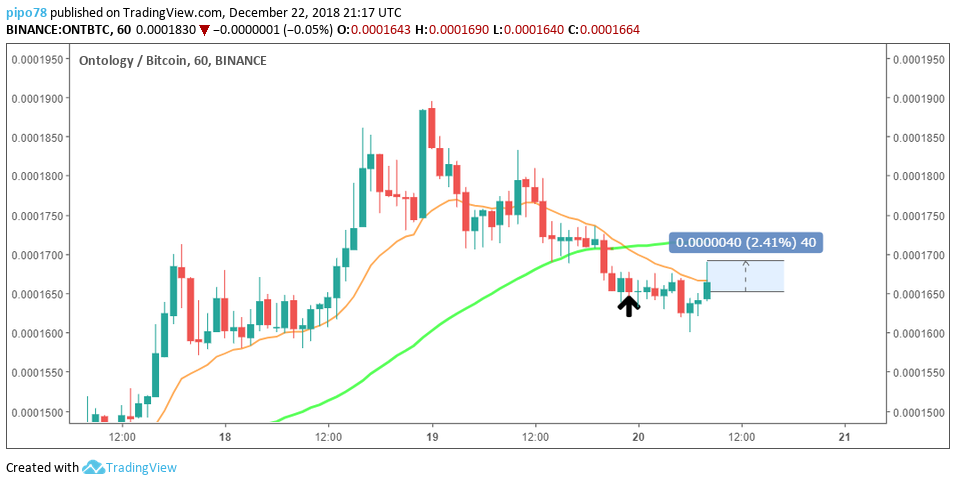
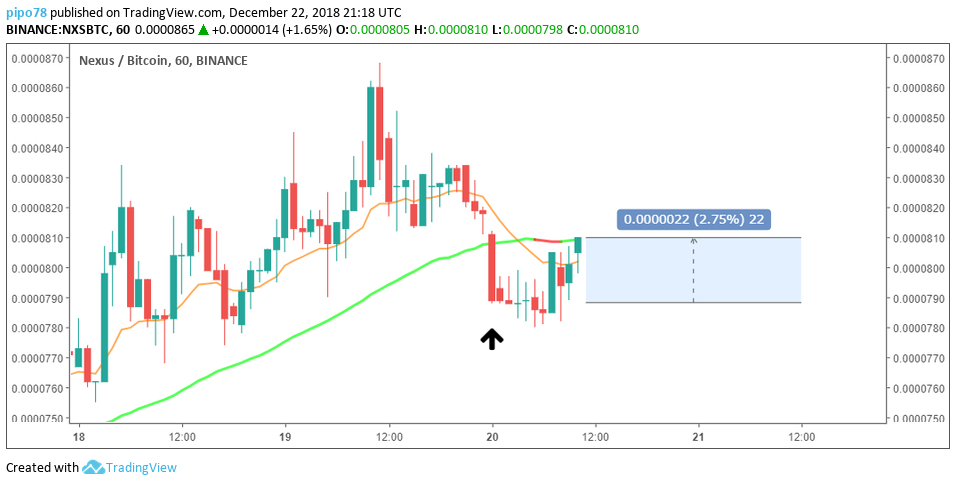
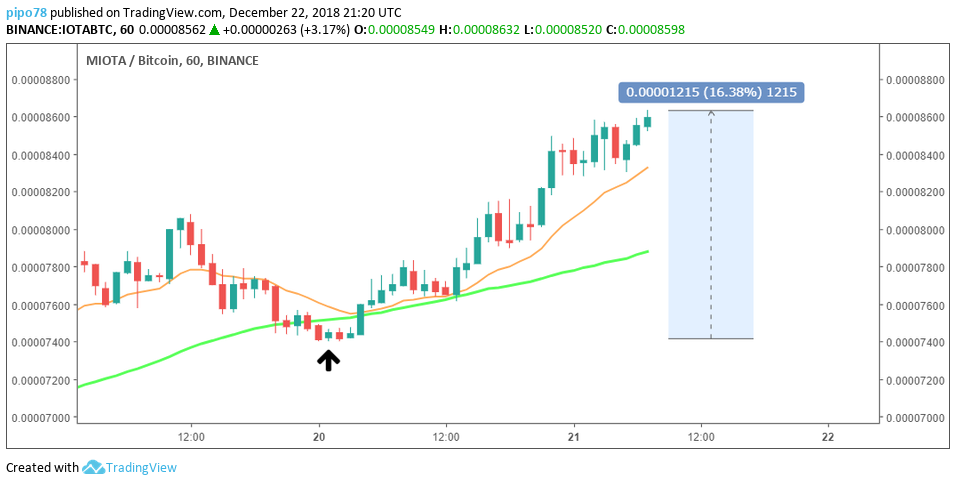
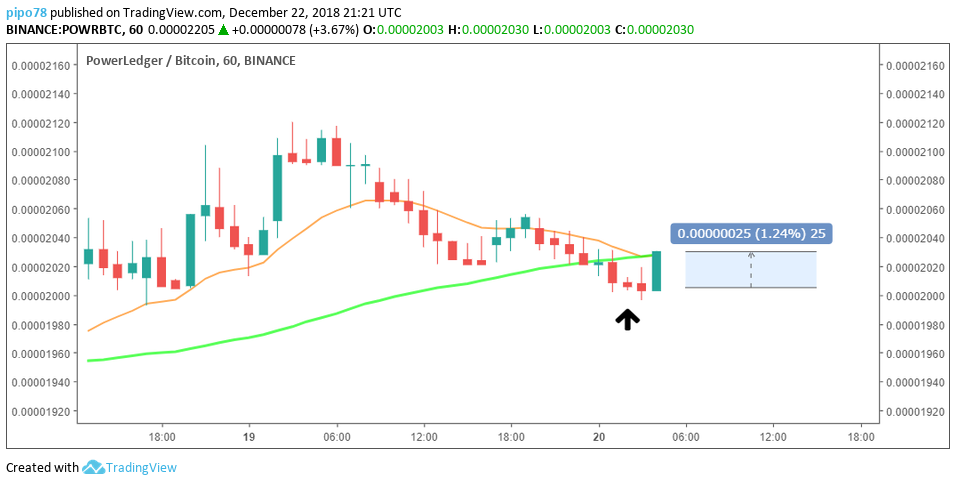
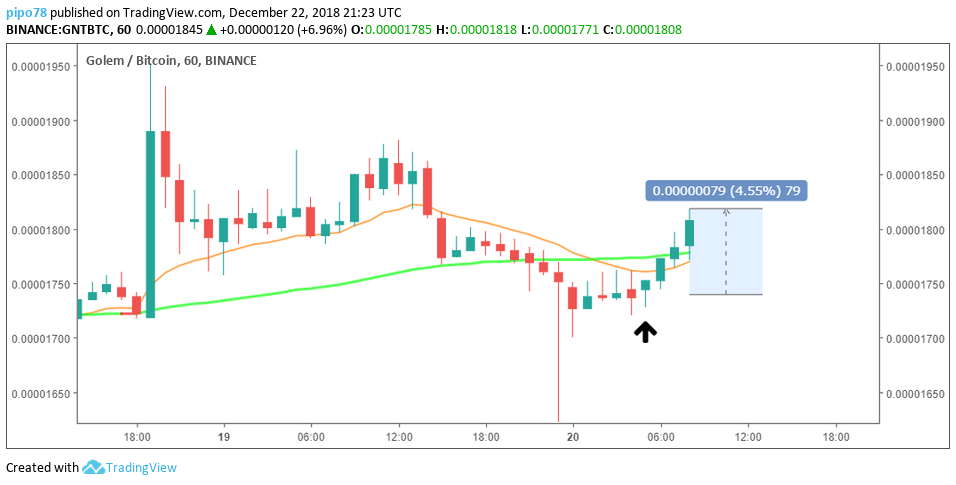
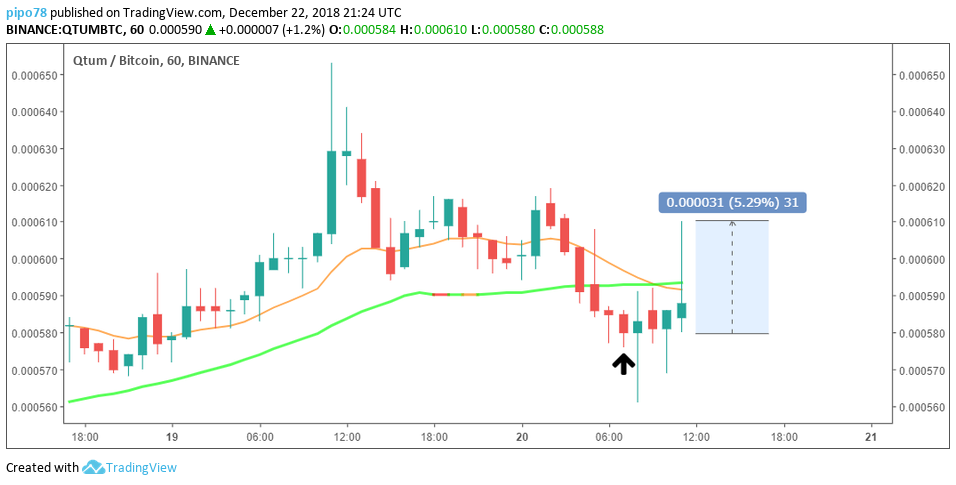
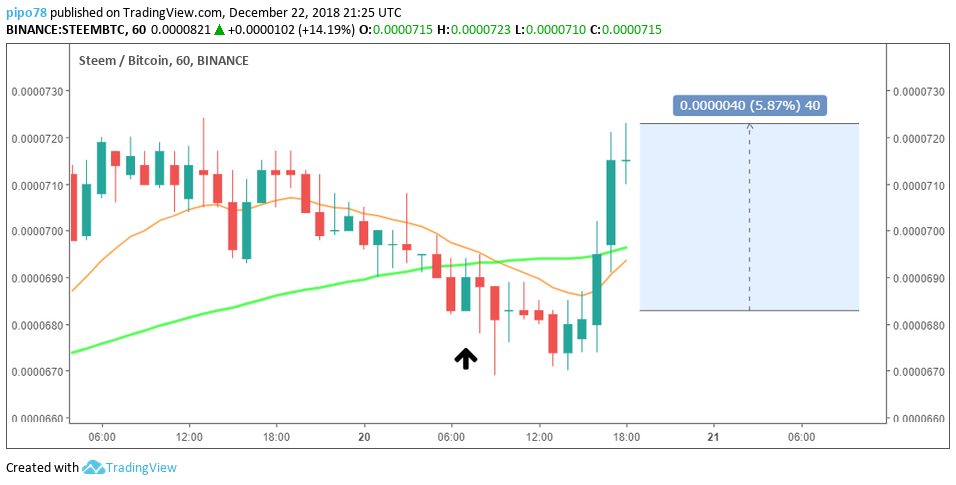
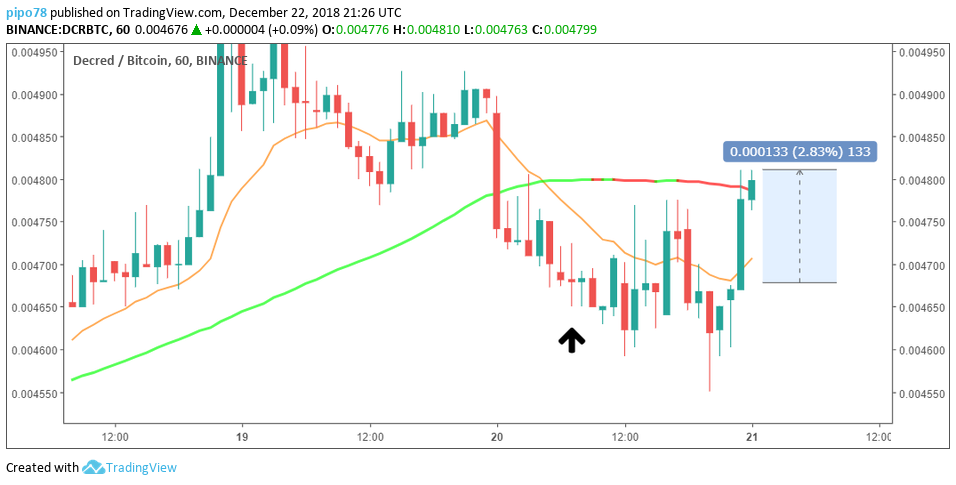
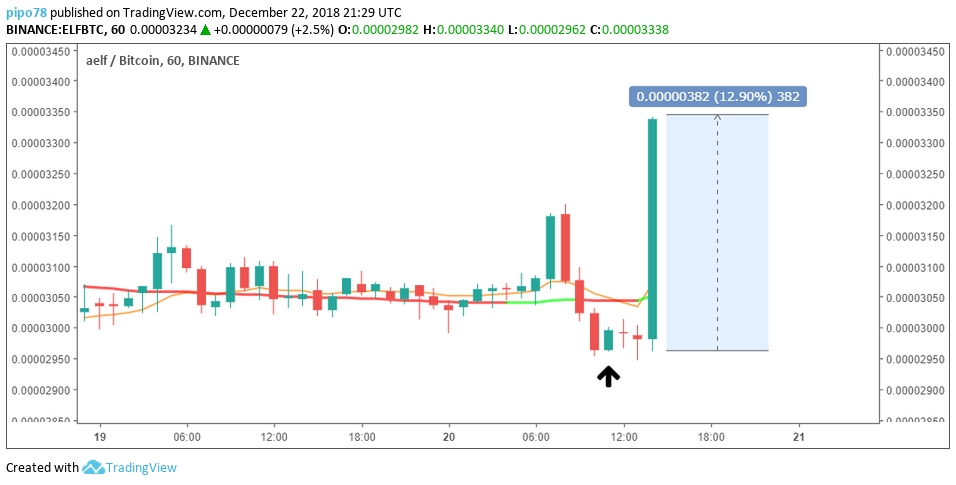
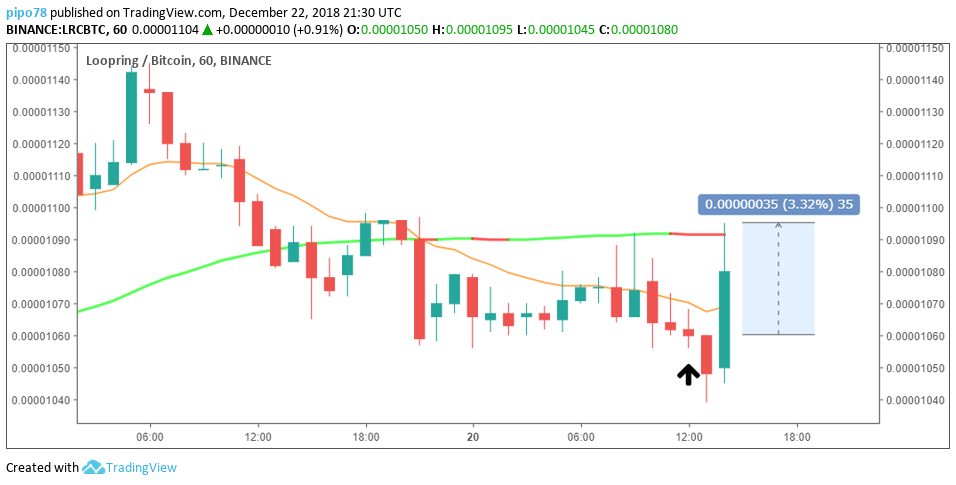
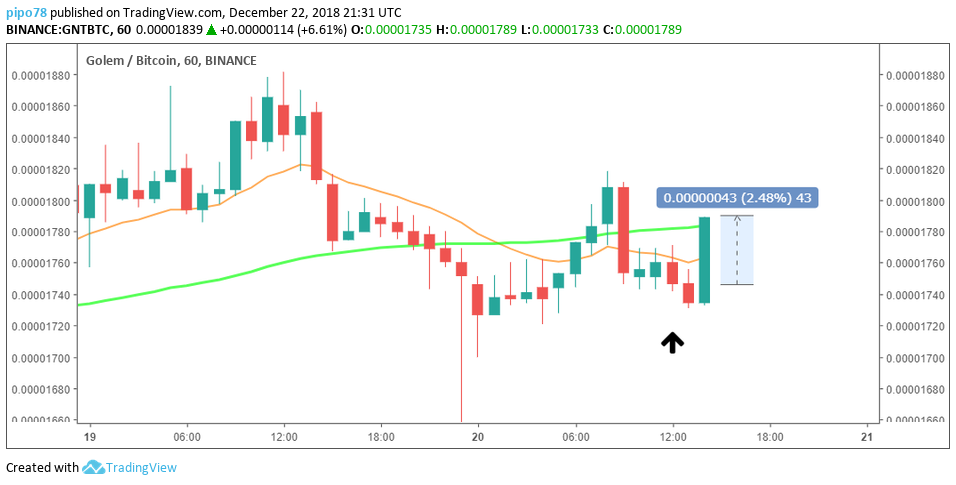
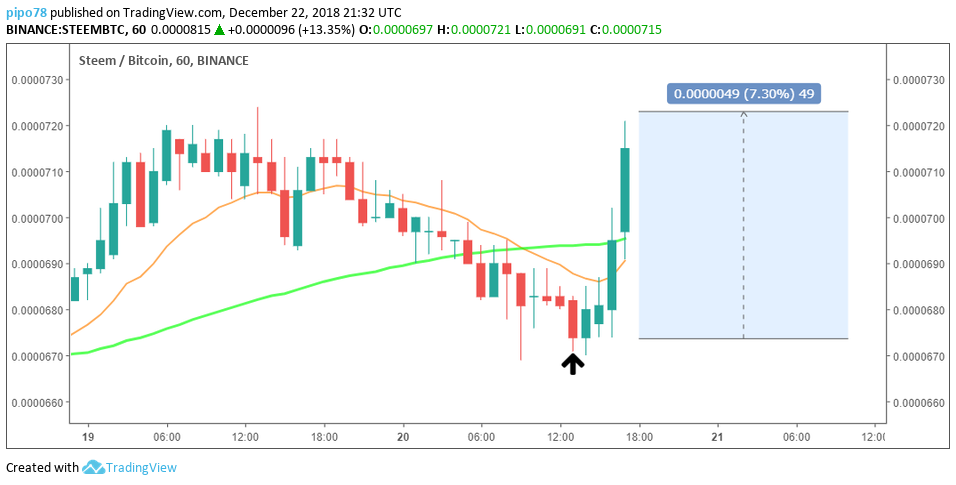

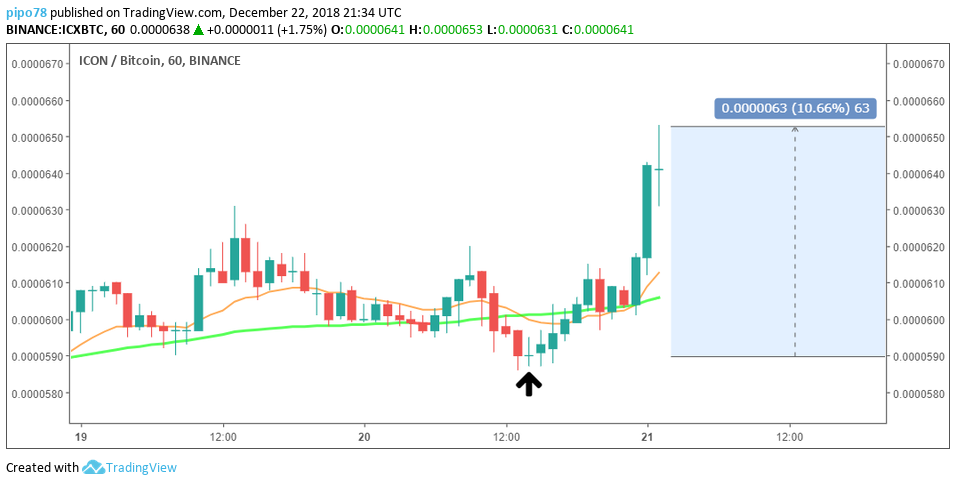
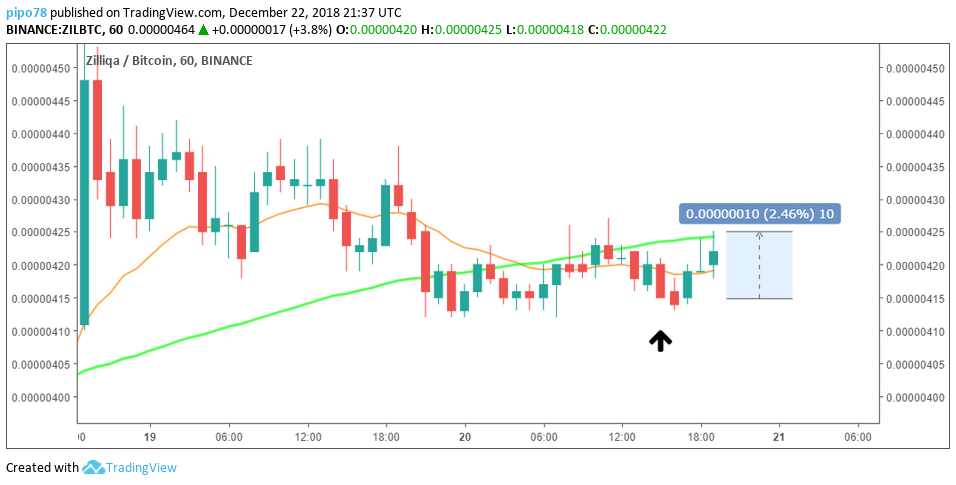
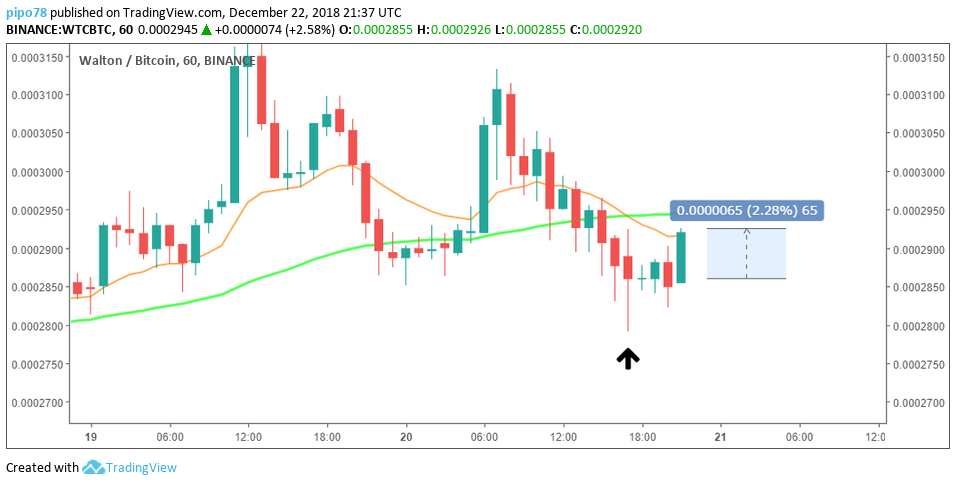
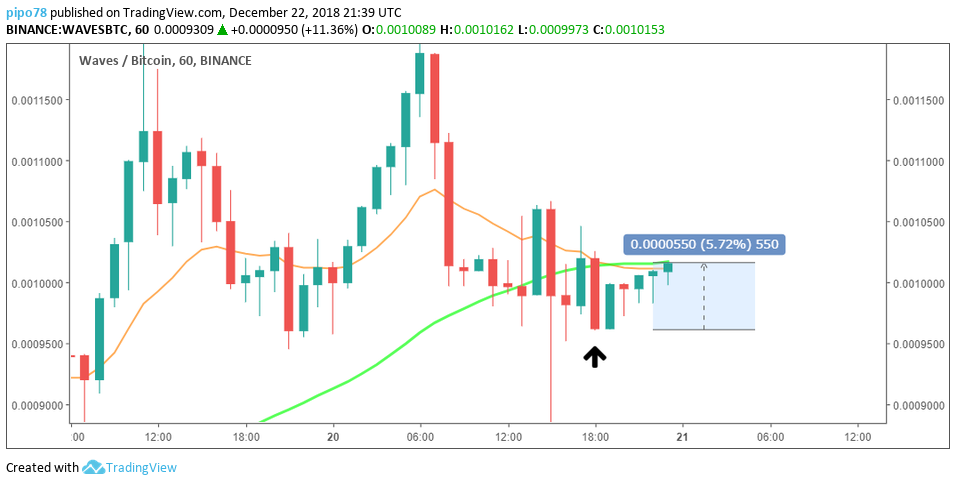
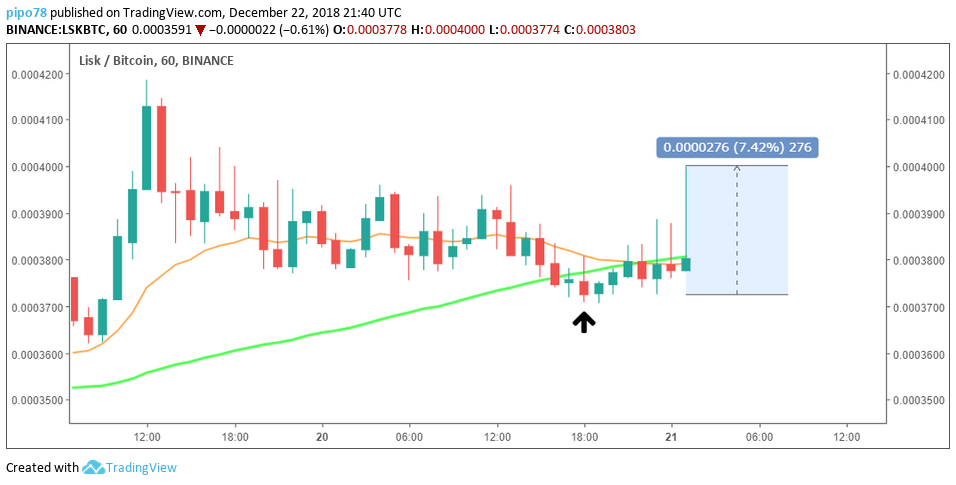
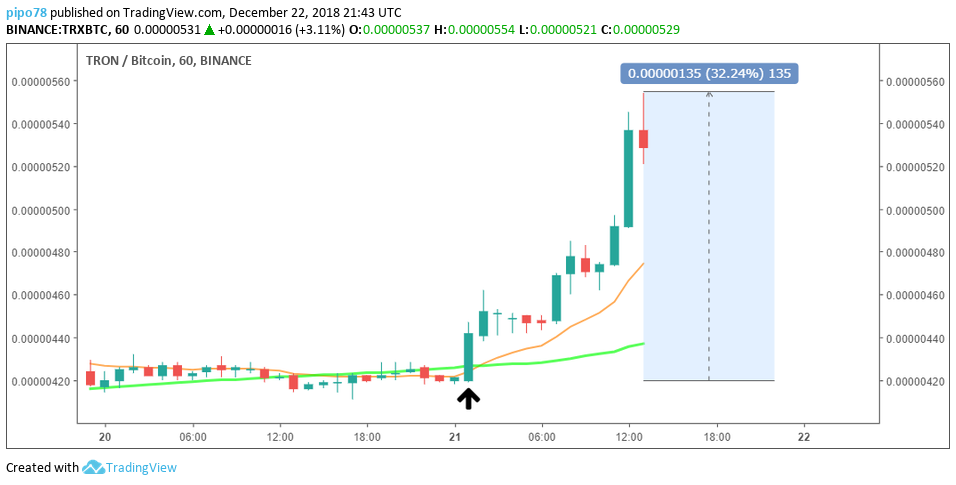
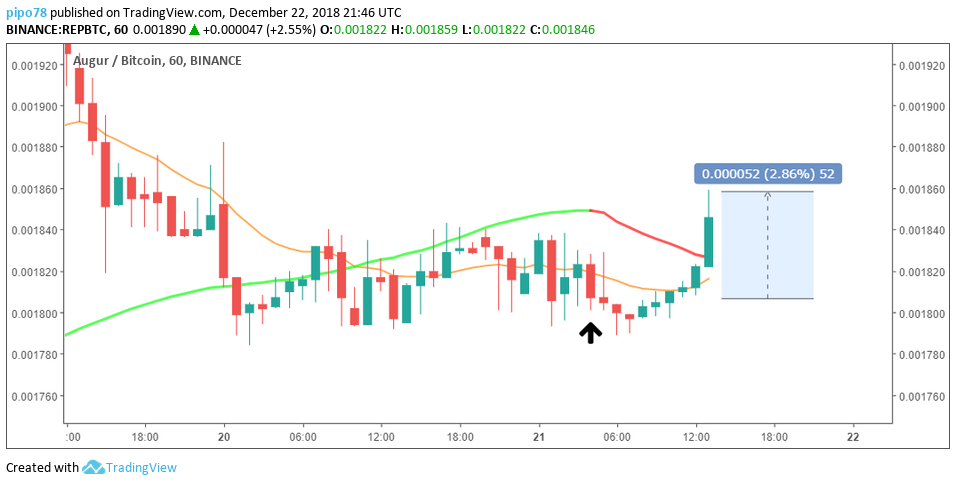

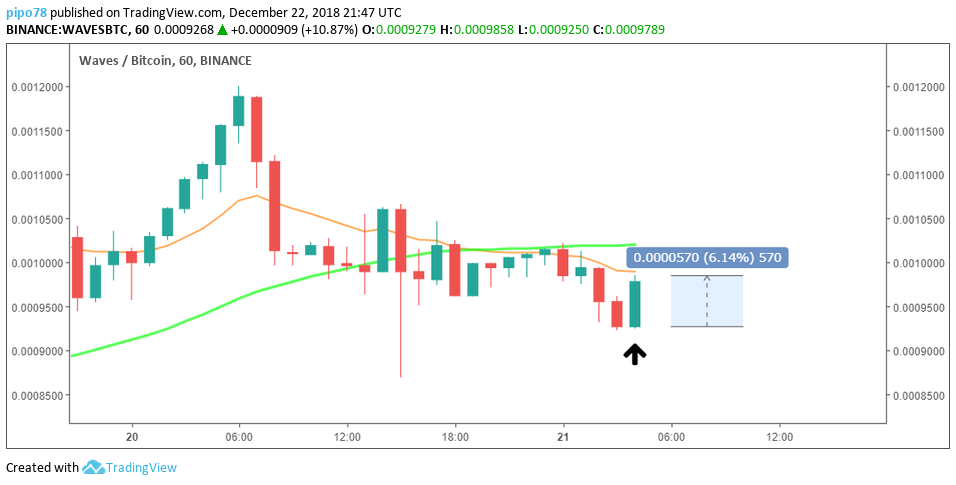
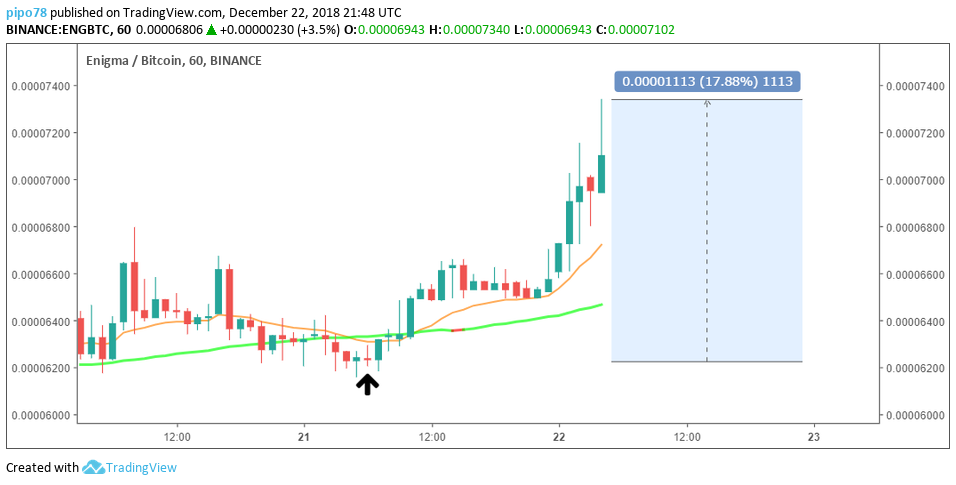
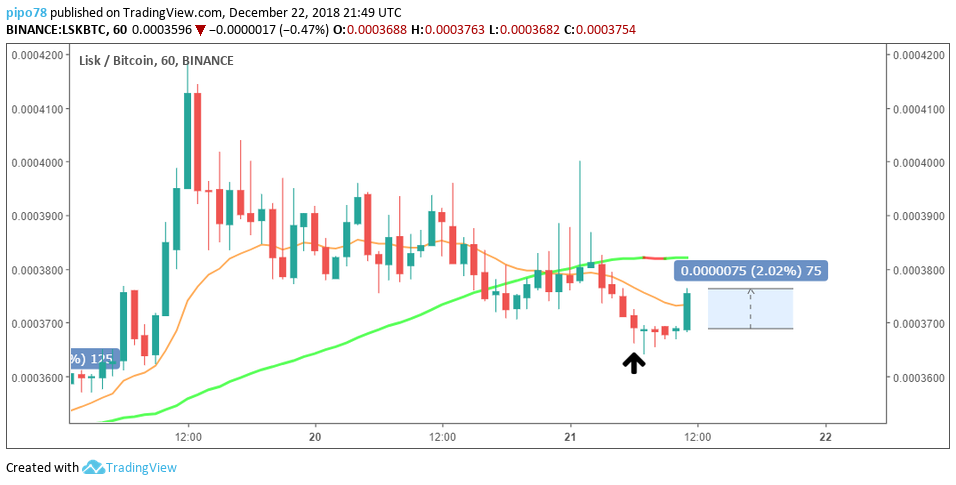
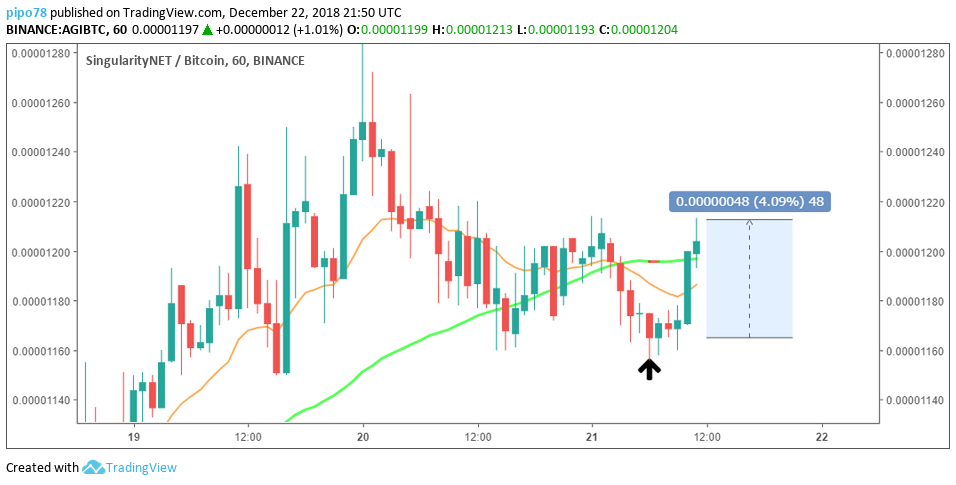
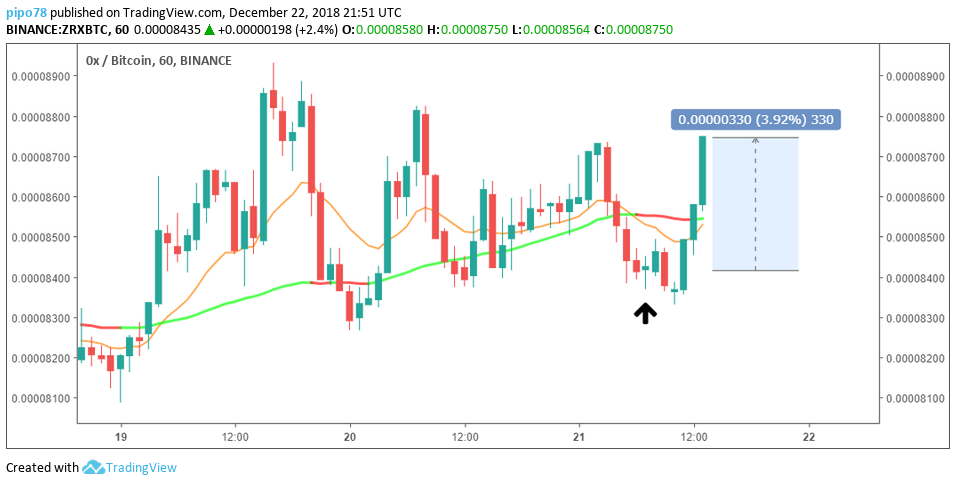
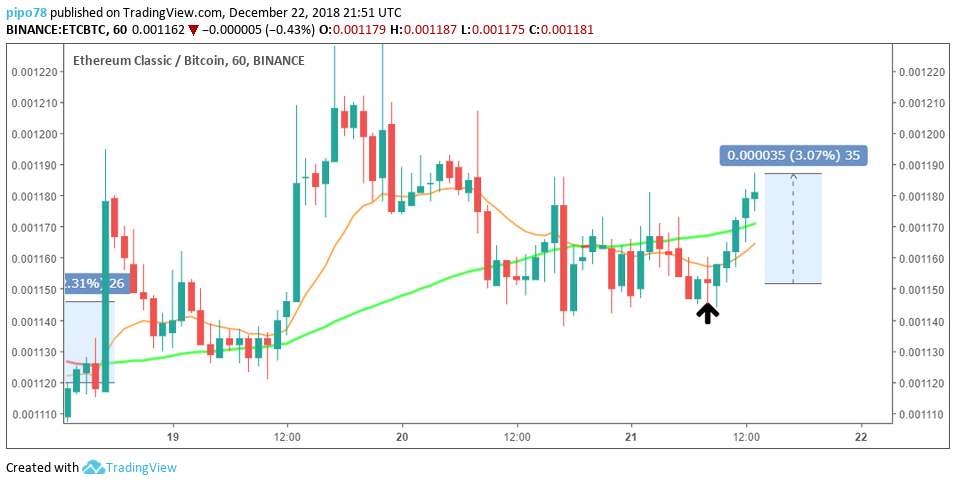
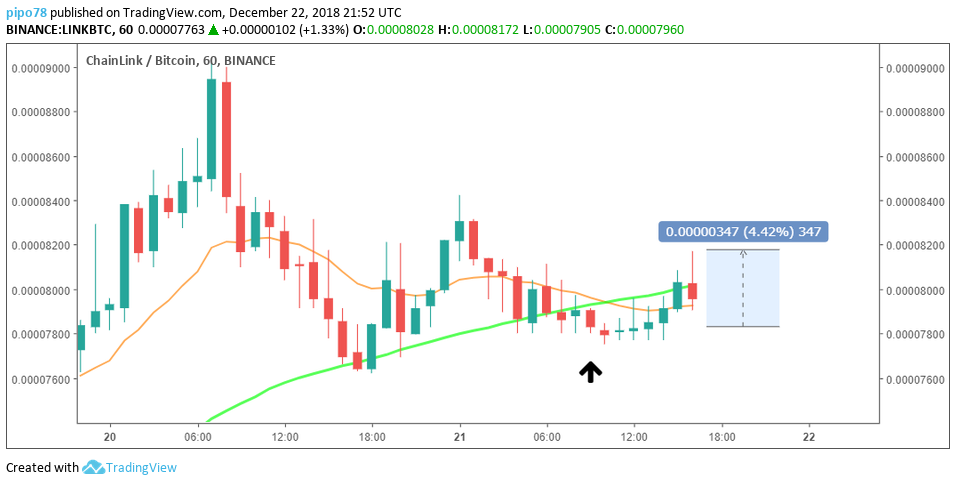
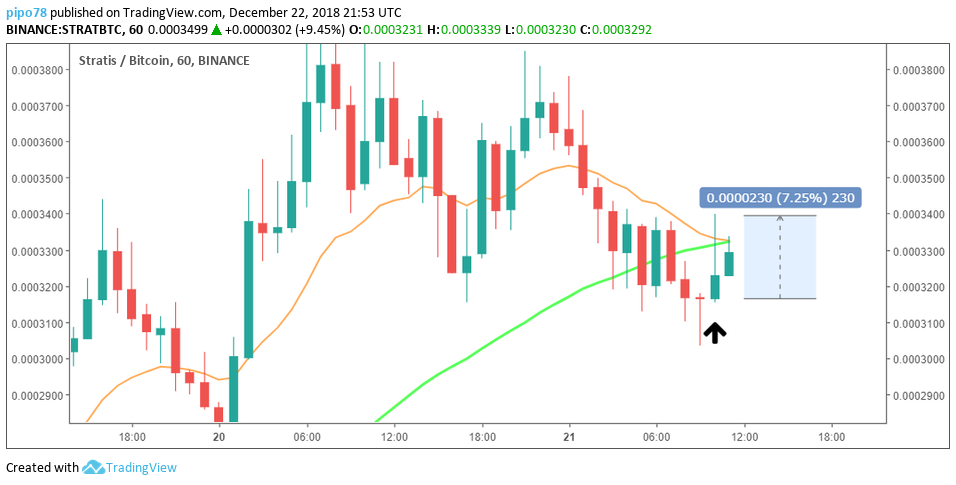
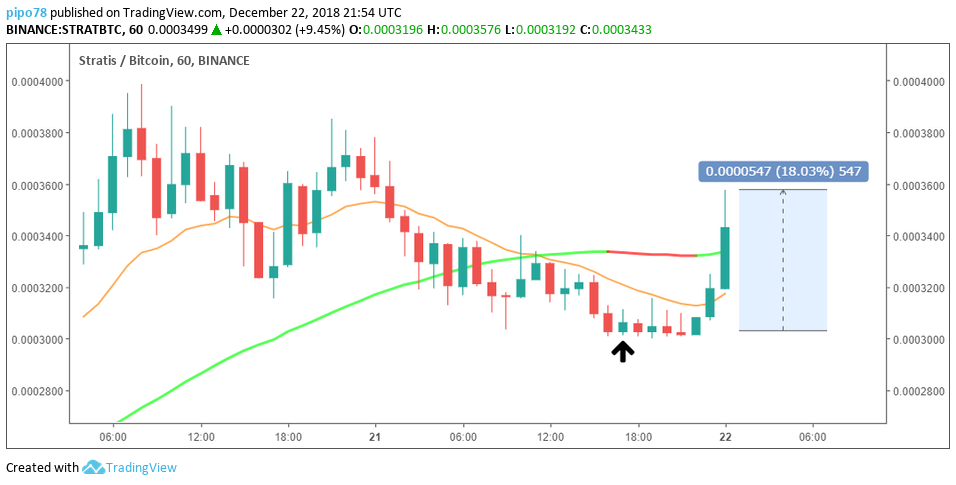
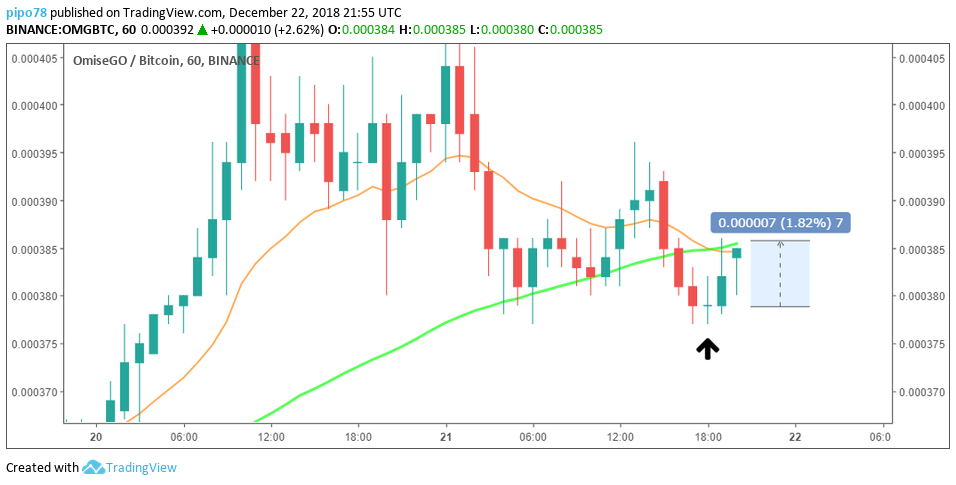

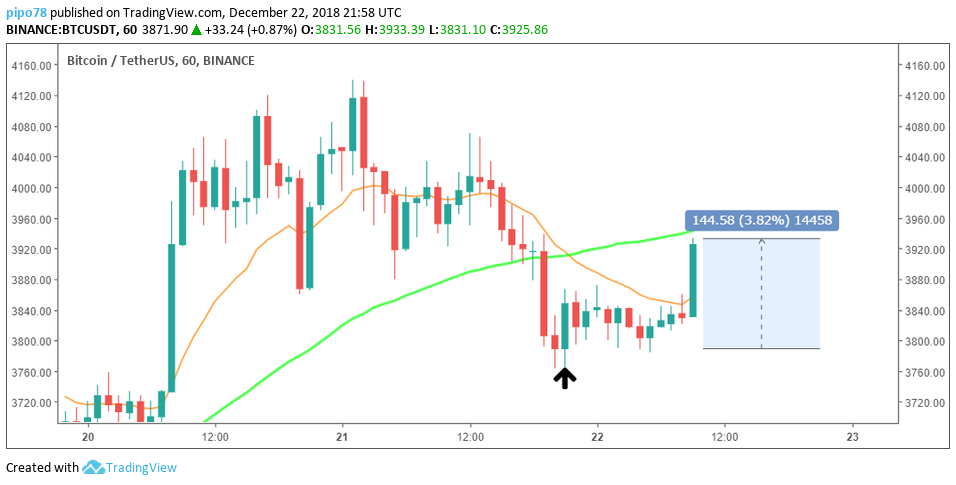

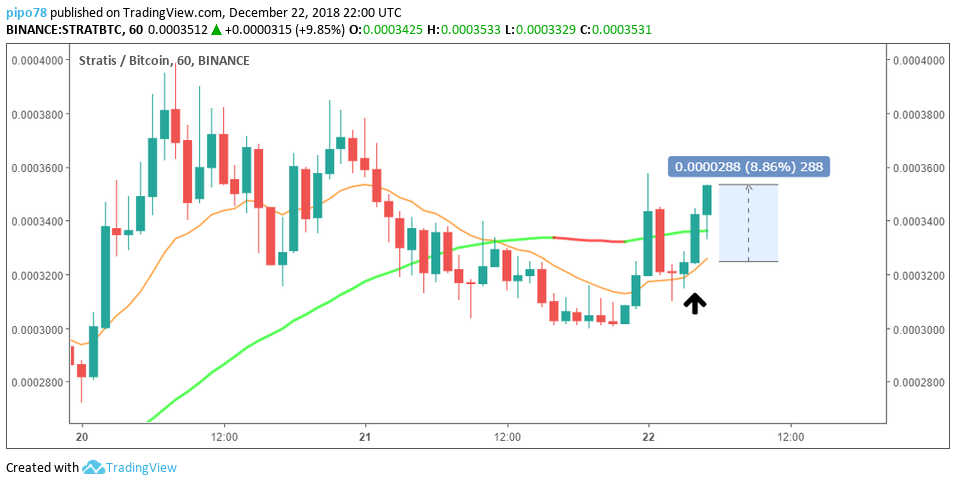
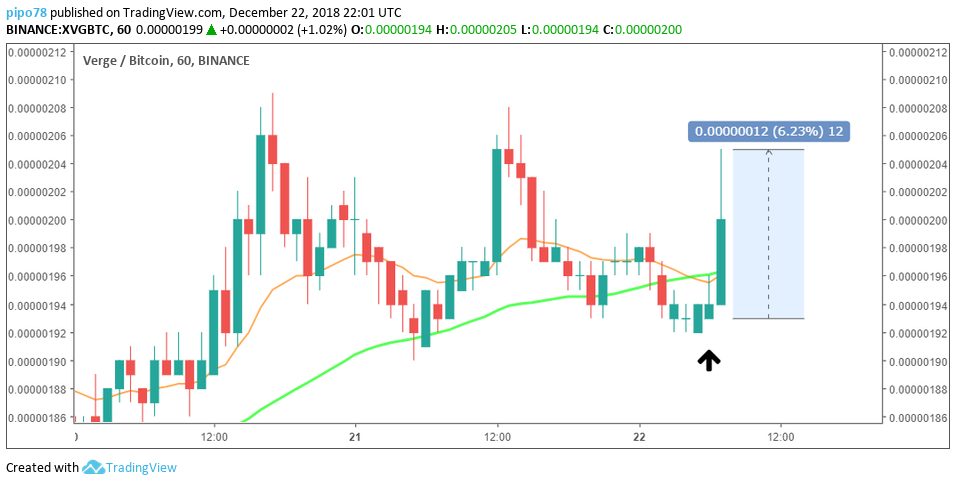


Successful mean-reversion trades are trades that returned upwards to the mean (ema15 or sma50), while the mean was still above entry level (break-even).
I have created a mean-reversion indicator script. You can download this Tradingview indicator script on the indicator page.
Good luck trading these high probability mean-reversion setups!
In the next bonus chapter I will show you how I trade entire trends.
Click below to continue