My own trading system is not based on candlestick patterns. But I do think it is essential knowledge that every trader should possess.
If only because candlestick patterns are used by many traders and therefore have a self-fulfilling quality.
Next to that human behaviour is often very predictable and patterned. I have experienced that looking for candlestick patterns on very short timeframes is often too dangerous, as the noise on the shorter timeframes makes them less reliable. So when I do look for these patterns, it is usually on a 1 hour or higher chart.
In the previous lesson I focussed on individual candlesticks. In this chapter I will focus on complex and difficult patterns which have been identified.
Engulfing candlestick
An engulfing bar fully engulves the previous candle(s).
In this pattern the wicks are not really important, therefore we only focus on the bodies of the candles. There is a bullish and a bearish version, they behave like opposites:
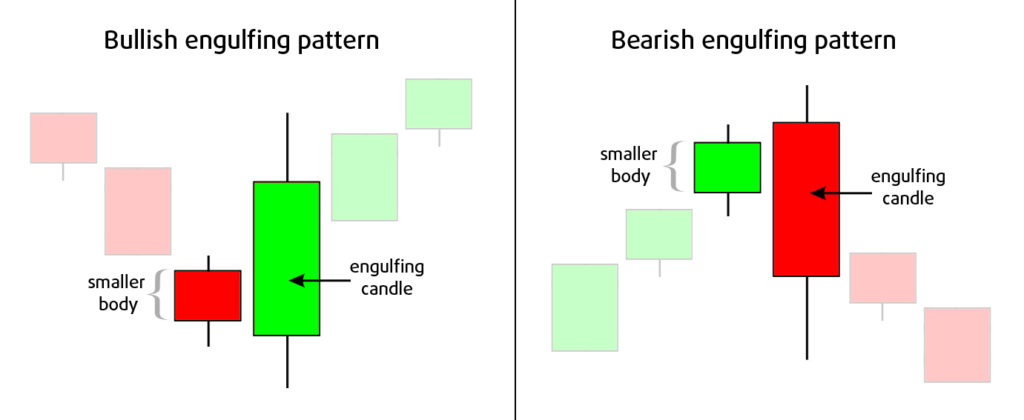
- The bullish version implies buyers dominance, as the buyers pushed price from below the previous close back up to above the previous open. When this pattern accours in a downtrend it could signal the end of the downtrend or even a trend reversal to an uptrend.
- The bearish version shows us sellers dominance. When this occurs in an uptrend it could signal the end of the uptrend or even a reversal to a downtrend. You can try for yourself, open a couple of charts, and look if you can find engulfing patterns yourself.
Even though this pattern is a nice indication of a trend reversal, it is not a real good signal to enter a trade. In my course I teach you the most important part: How to determine high precision entries.
Doji candlestick
A Doji is one of the best known candlestick patterns. It is a candle that has opened and closed approximately at the same price, and so it looks like a cross. It means buyers and sellers are indecisive, and it is not yet clear what direction the market will go. When it happens in a trend it often signals a trend reversal. Here you have an example:
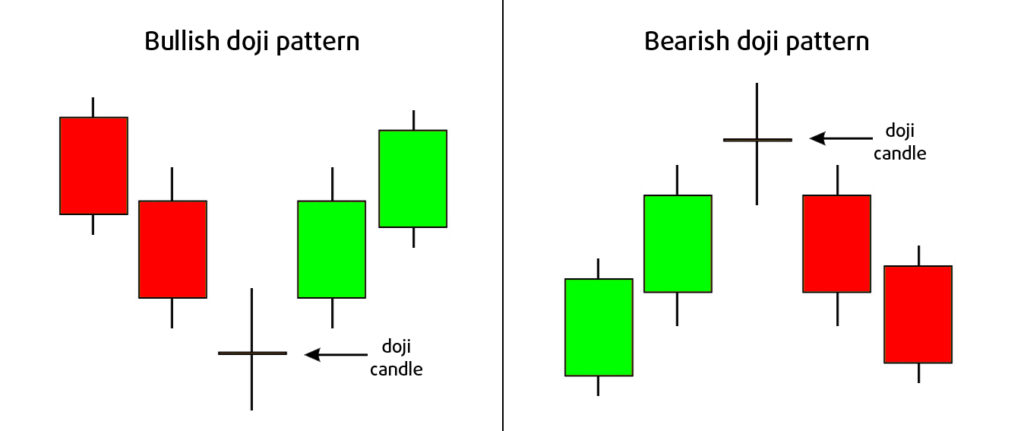
- In the bullish example (left) you first see a downtrend with sellers dominance. After that you see sellers are unable to keep the price down as buyers buy the price back up, and rice fails to close lower. Next you see the doji was the beginning of the reversal to the upside.
- In the bearish example (right) you first see an uptrend with buyers dominance. Next a doji candle is formed, indicating the buyers failed to keep the price up as the sellers pushed it down and price failed to close higher. Next you see the doji was the start of the reversal to the downside.
After a trend it is often a reversal signal. In all other situations it is a signal of indecisiveness, and balance between buyers and sellers.
Dragonfly doji candlestick
A Dragonfly doji is a signal that there is a lot of buying going on at that price level, indicating a strong support level.
Price probed down that level, but was bought back up by the buyers, as it failed to close lower. It means demand is starting to outweigh supply. This kind of doji is an even stronger indication for trend reversal or end of the trend, than the regular doji.
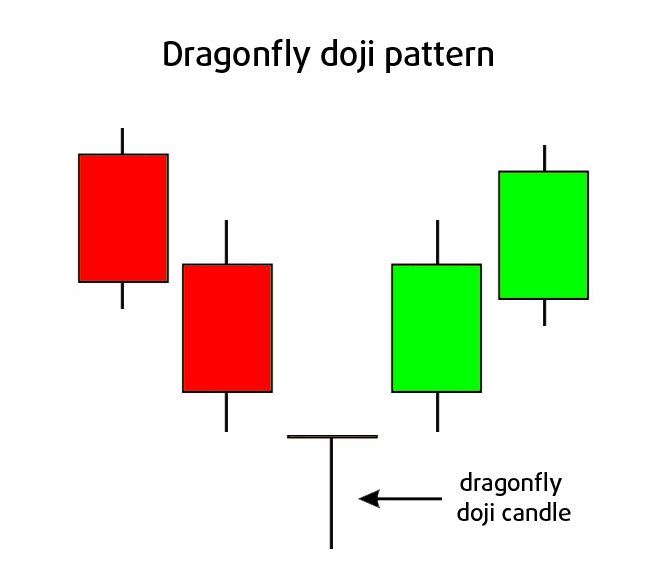
So in a downtrend it is a bullish signal. It is most reliable when it occurs at a support level. It looks a lot like the hammer candle, more about that one later.
Gravestone doji candlestick
When you reverse the dragonfly candle you get the gravestone candlestick.
As opposite of the dragonfly this is a bearish signal. Again open and close are (approximately) at the same level, but the tail is upwards. It indicates bought price upwards and price tested a resistance zone, but failed to stay up as sellers sold it back down.
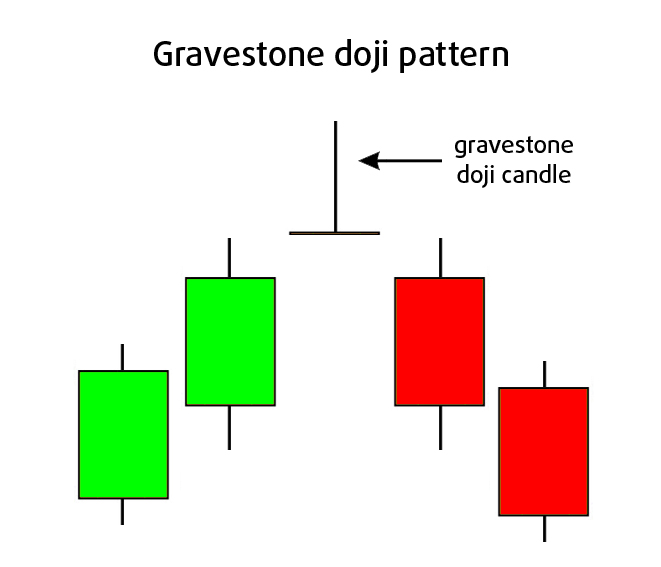
In an uptrend this often signals the end of the uptrend and a reversal to the downside. The signal is more reliable near a resistance level.
Morning star candlestick
The morning star candlestick pattern is a bullish reversal pattern:
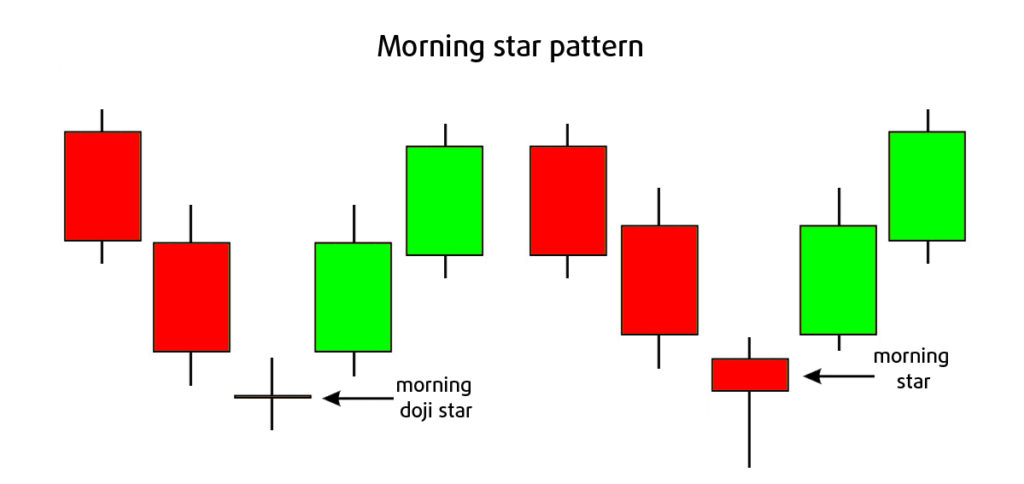
It happens in a downtrend and consists of three candles:
- First a bearish candle, long enough to indicate sellers are still in control.
- Next a small or doji candle indicating sellers lost momentum. This can be a bullish or bearish candle.
- Next a bullish candle, long enough to indicate buyers convincingly took over control.
This pattern is also more reliable if it happens after a downtrend and at a support level.
Evening star candlestick
The evening star candlestick pattern is a bearish reversal pattern and looks like the morning star, but upside-down:
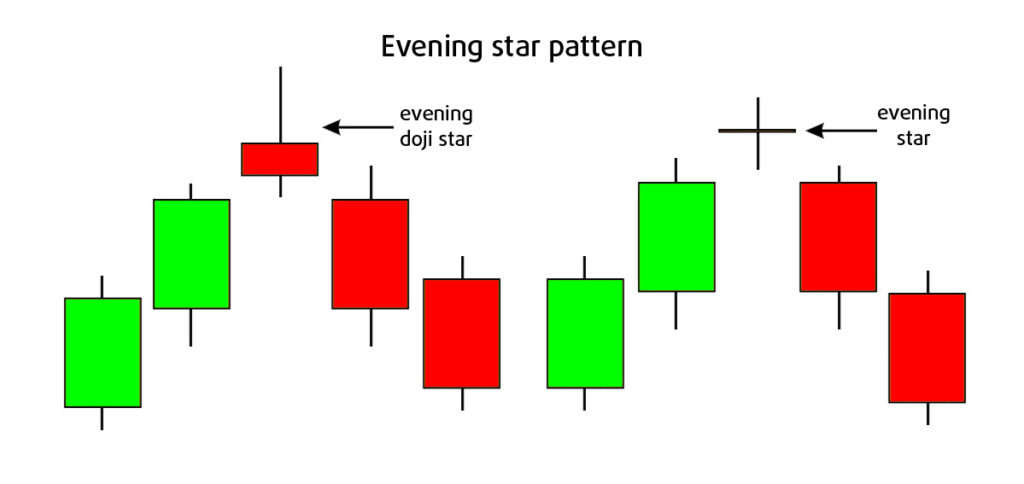
It often occurs late in an uptrend and like the morning star formation also consists of 3 candles.
- The first candle is a bullish candle.
- The second candle is a small candle or even a doji. This candle can be bearish or bullish. It indicates the buyers lost strength and a possible end of the trend or trend reversal is near.
- The third candle is a bearish one, long enough to indicate sellers convincingly took over control.
This pattern also is more reliable when it happens late in an uptrend and near a resistance level.
Hammer candlestick
Although many Technical Analysts and price action traders see this as a different candle formation, in my mind the Hammer candlestick gives a similar signal as a Dragonfly candlestick.
A hammer candle also consists of a very short body and a long wick. The difference is that hammers never have a cross-shaped body like the dragonfly candle often has (open and close at the same level), although dragonfly candles themselves are also often depicted having bodies with open and close at different levels.
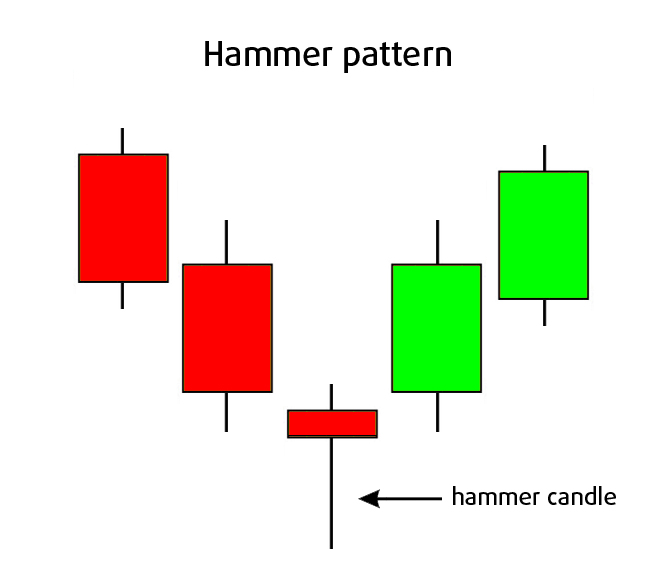
So in my mind these two candlestick types are quite interchangeable. An important difference is that the hammer candle is often depicted with a small wick on top (making it look even more like an actual hammer) something I never saw in a depiction of a dragonfly candle.
So I can give a similar explanation for the hammer candlestick formation. A hammer candlestick can be both bullish or bearish. A bearish candle is often called an “inverted hammer” or a “shooting star”. I will focus on the bullish hammer here. It is a signal that there is a lot of buying going on at that price level, indicating a strong support level.
Price probed down that level, but was bought back up by the buyers, as it failed to close lower. It means demand is starting to outweigh supply. This kind of candle is a strong indication for trend reversal or end of the trend. So in a downtrend it is a bullish signal. It is the most reliable when happening at a support level. In an uptrend the inverted hammer is a bearish signal.
Harami candlestick or “Inside-bar” Pattern
The Harami or Inside-bar candlestick pattern is a two candle formation. The body of the second candle is contained within the body of the first candle. In japanese Harami stands for “pregnant”, as the first candle is large and is called “the mother” and it contains the second smaller candle called “the baby”.
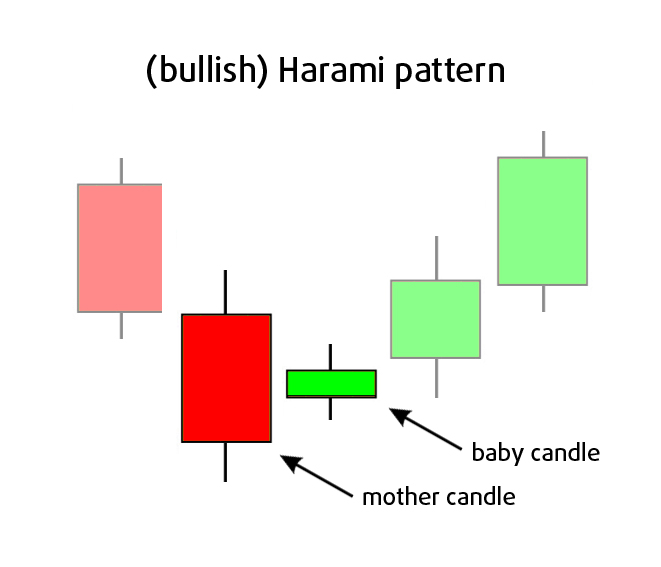
Again there are both bullish and bearish versions of this pattern. The most important property of this pattern, is the second candles closes within the body of the first candle. This formation is also a sign of indesiciveness as price consolidates at this level.
But be aware this doesn’t mean price will reverse, it can also signal a pause in momentum, whereafter price will just continue its trend.
Always consider a trend “late” after 3 waves up. After that the chances for reversal increase. When the baby candle is a doji, chances for trend reversal are bigger too. The end of a trend also often happens at key support or resistance levels.
Tweezer Tops and Bottoms
The Tweezers Top happens when buyers push price way higher, but in the next candle sellers push price way lower again, closing around or below the open of the previous bullish candle.
The opposite Tweezers Bottom shows us sellers pushed price way lower, but in the next candle buyers bought the price way higher again, closing around or above the open of the previous bearish candle.
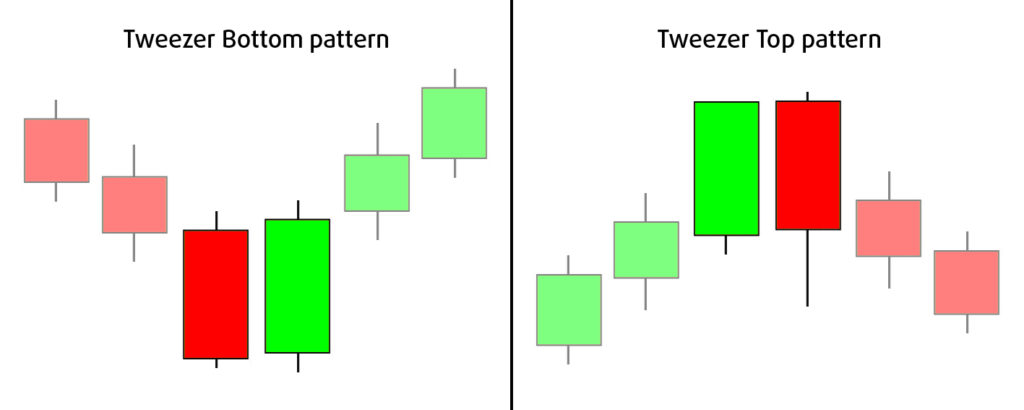
So basically it is a substantial bearish or bullish candle followed respectively by a bullish or bearish candle of similar height.
I have shown you some of the most popular candlestick patterns. In my mind the most important candlestick patterns all tell the same kind of story, namely buyers push price higher but lose momentum eventually (or sellers push it lower and lose momentum eventually). This means:
- either that the sellers (or buyers) can take over: a trend reversal
- or that trend can continue after this pause: a trend continuation
But besides these major patterns, there are also other important patterns, that often receive less attention. These patterns are for example a sign of a strong trend:
- Candles lack wicks, but have substantial bodies
- Successive candles do not overlap eachother, or even better:
- Gaps between successive candles
Although candlestick patterns are powerful, as many traders trade based on these patterns, I would never use them without any other technical analysis.
In the next free chapter I will show you how to trade using indicators.
Or Enroll in the Pro Course & Become a Pro Trader!