Chapter 3.3: The Golden Pocket

Fibonacci Retracement Levels

Fibonacci retracement is a method for determining support and resistance levels. It’s named after the Fibonacci sequence. In this sequence, each number is the sum of the two preceding numbers (1, 1, 2, 3, 5, 8, 13, 21, etc). It’s a growth pattern we come across a lot in nature and living systems. 
Fibonacci retracement is based on the idea that markets will retrace a specific percentage of a move, before continuation in the original direction. More about the basics of Fibonacci retracements in this introductory lesson:

https://tradingcryptocourse.com/free/5-9-2-technical-analysis-fibonacci/

Golden Pocket

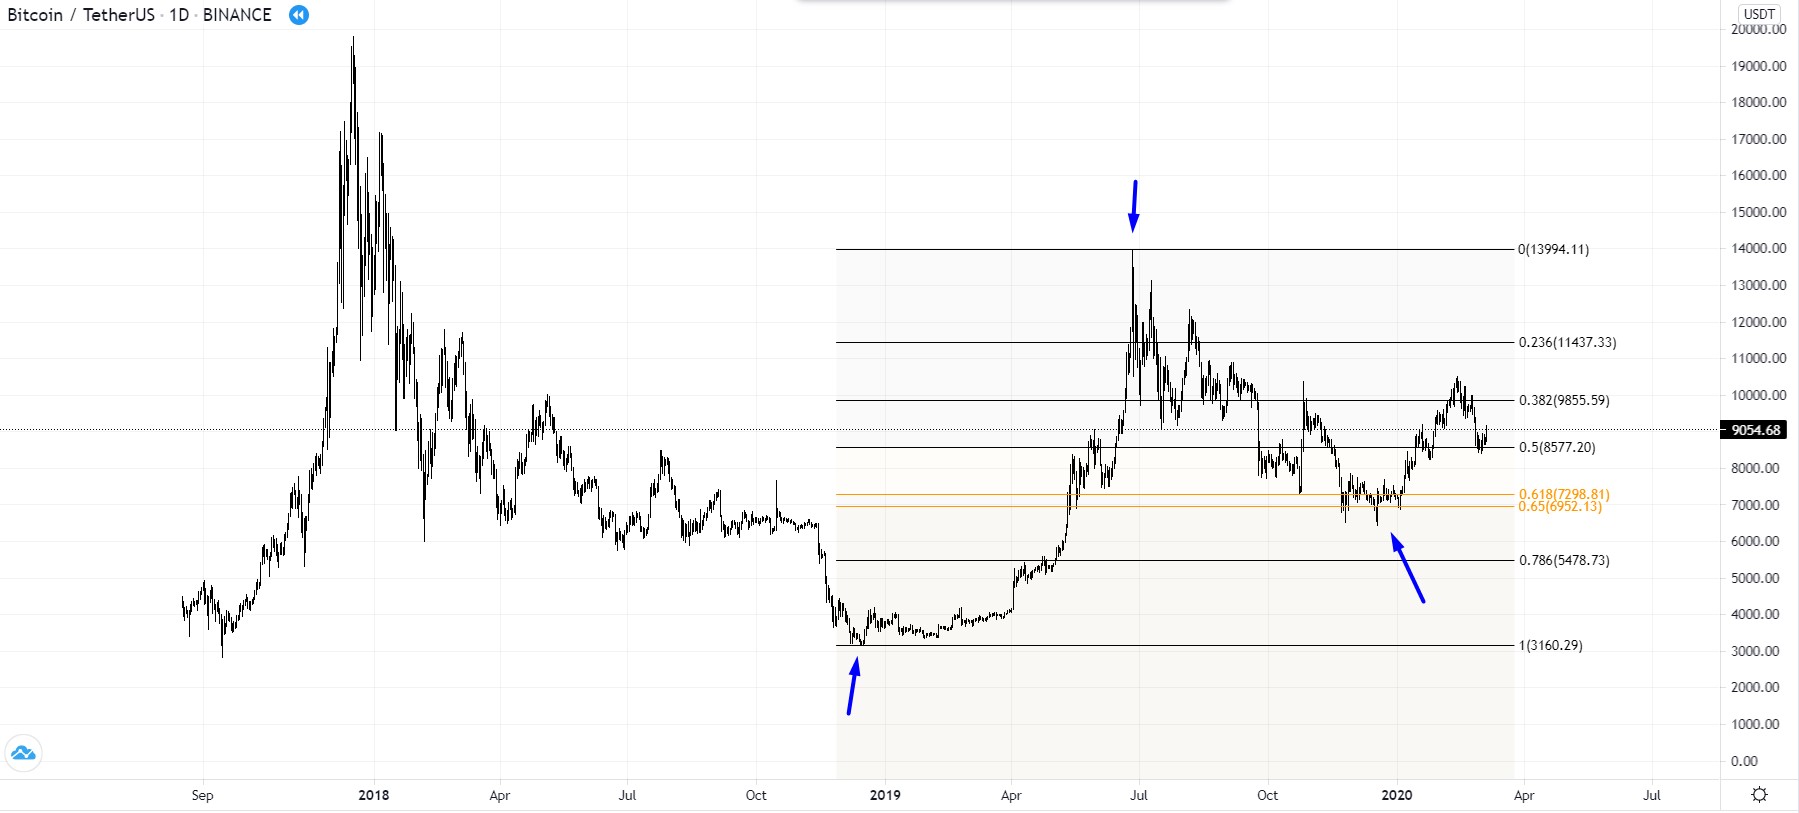
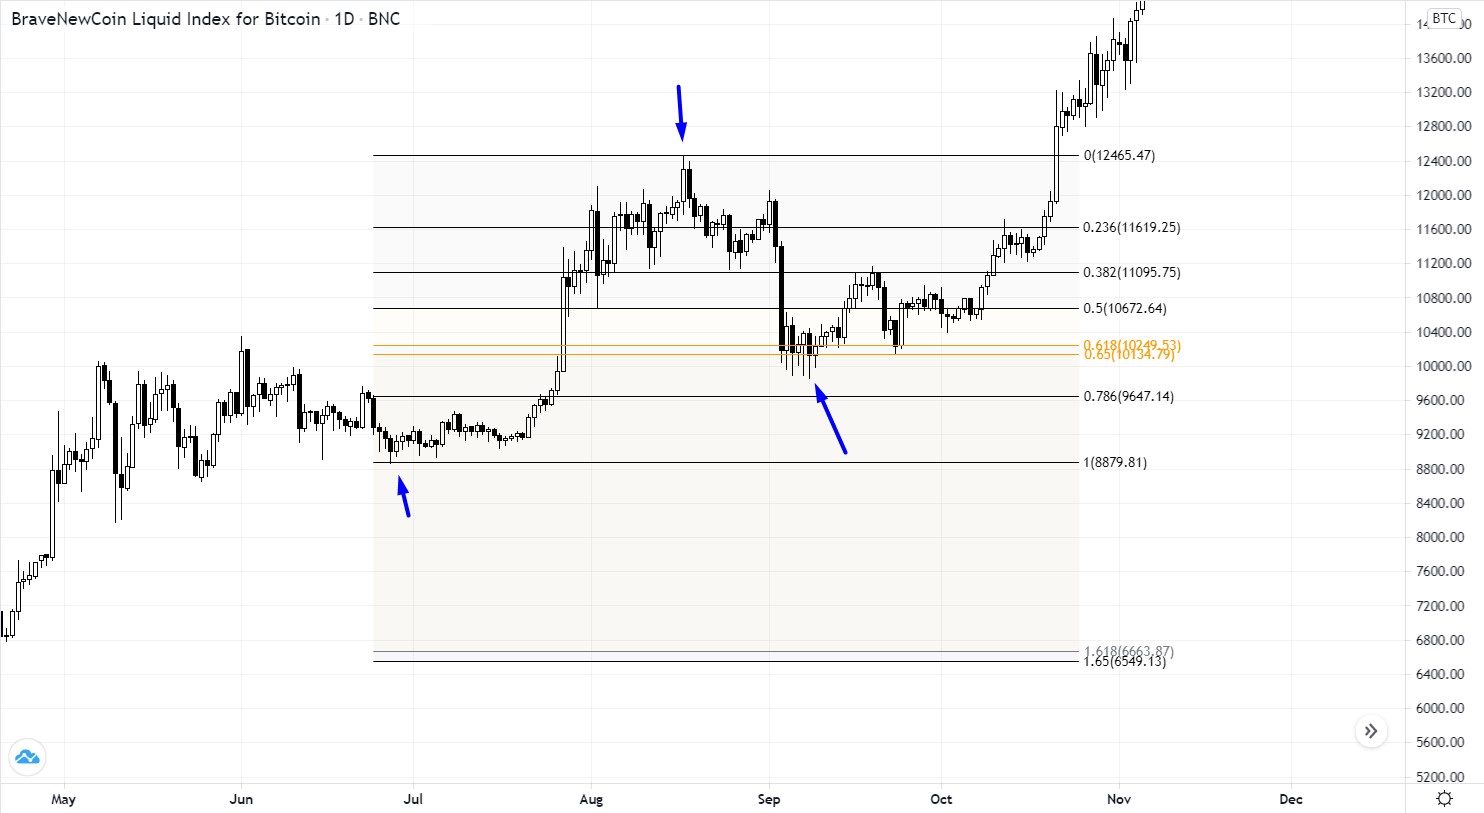
The golden pocket is the area between the 0.65 and 0.618 Fibonacci retracement. The 0.618 retracement level is actually the famous golden ratio. The golden pocket is a high probability retracement zone next to this golden ratio level, and is named after it.
The recent years it has become a very important level for Bitcoin. Many algorithmic bots seem to use these levels as well. So each trader should be fully aware of it when drawing their s/r lines, and finding good entry levels.

There’s not much more to say about it. So I’ll let the charts speak for themselves.

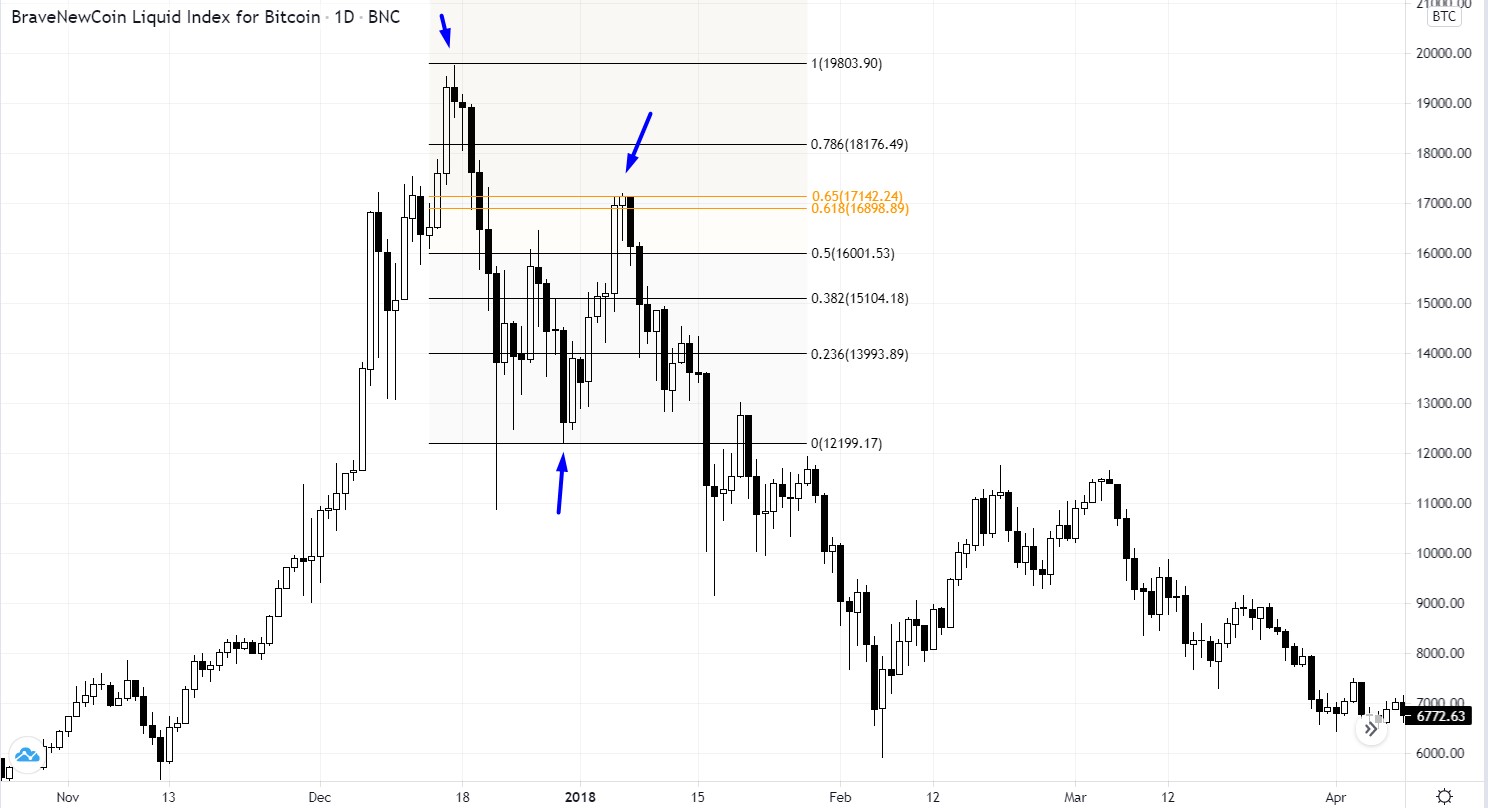
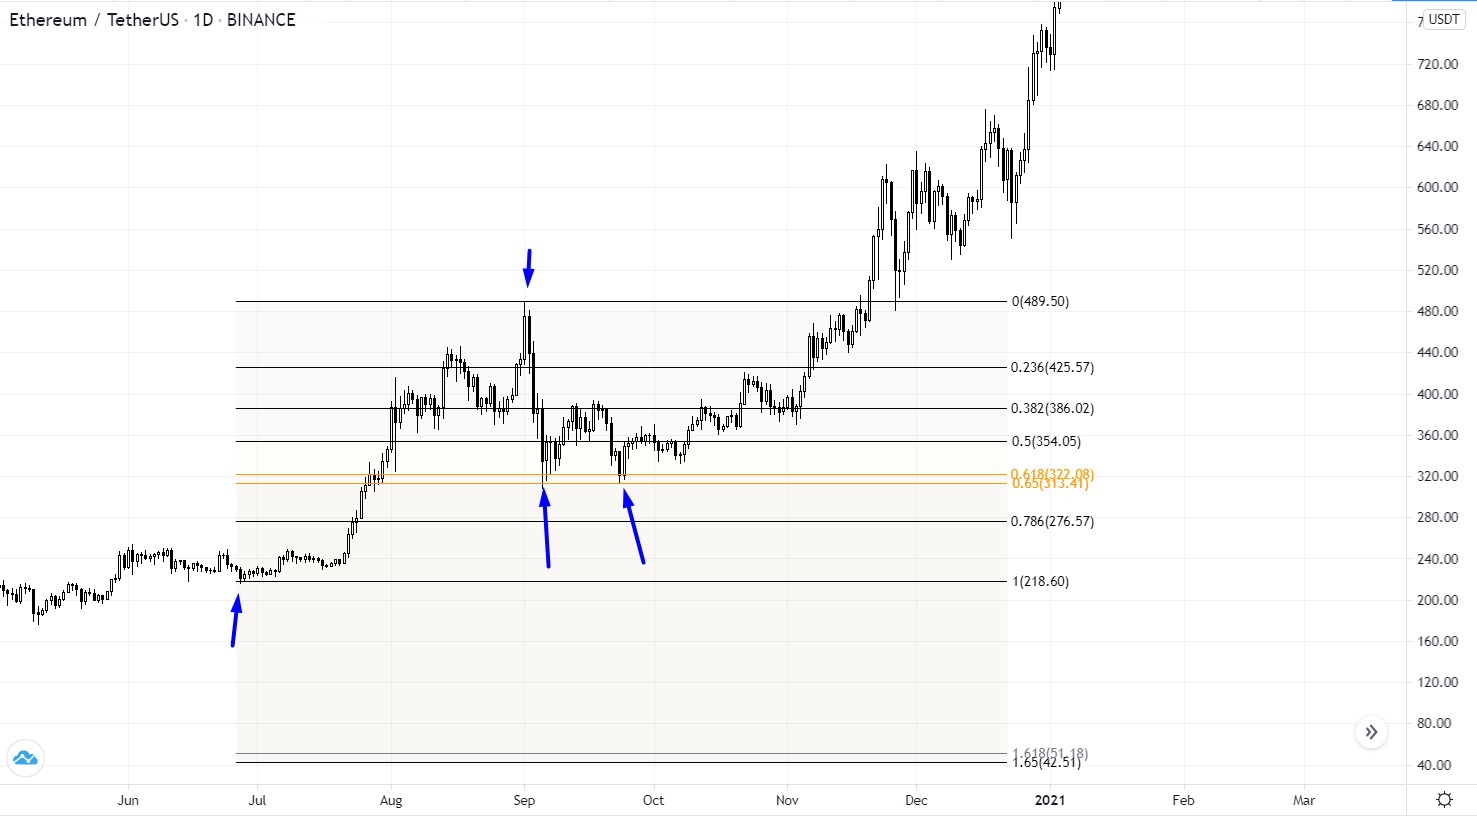
You’ll find them on very large scales:

You’ll find them in retracements in uptrends:

You’ll find them in downtrends, where we draw them upside-down, like this:

You’ll find them in double tops (and double bottoms):

Even “Bart Simpson” style structures seem to obey the golden pocket sometimes:

It can help to find the last exit before the trend reverses:

It even works in altcoins (although I mostly come across them on Bitcoin charts):

This was obviously part of the Chart Structures lessons. But because it’s such an important topic, it deserves its own chapter.
I hope from now on you’ll never forget the golden pocket when drawing your trendlines and looking for the end of a retracement.

To summarize this chapter:

  • Reading Chart structures is a skill that is essential for any Pro trader.
    I think one of the most important skills, because all trading indicators, MA’s etc. are derived from this.
  • I want to have a major support level right below my buy entries (or a major resistance level above my short entries).
  • Support levels are swing lows/ highs, round prices, and MA’s.
  • The closer to the support you buy, the higher the probability.
  • I prefer to enter in a Golden Pocket. These are my favorite high probability entry zones.
  • Buying below an uptrending SMA50 is my favorite trade (mean-reversion).
  • In a strong uptrend, the EMA15 often acts as support. If price breaks below it, then SMA50 is the next important support.
  • The SMA100 and the SMA200 are major support and resistance levels, always keep an eye on them.
  • Candle probes (wicks) below support (failed attempts to break it) are a bullish signal.
  • Converging supports / resistances often form an even stronger zone.


But as you have read in the previous chapters: next to chart patterns you also need: 

  • Trend to be going in the same direction as our trade.
  • Strengtha bullish RSI and volume to rise at the moment price breaks it or bounces off. And preferably the EMA15 moved away from the SMA50 in the direction of your trade.
  • You have now set your third step towards a high probability trade. Still 4 steps left to take before we can make a balanced trading decision. Remember: Never skip a step, or you might fall.

Keep it simple!

Click below to go to the next chapter 4: Higher Timeframes