In chapter 1 you learned the direction of the market has to be in your favor, and how to measure this. In this chapter you take the 2nd step: to look if the trend has enough momentum. Momentum means STRENGTH. You want a strong trend.

It is important to emphasize that trend is a lagging indicator. It’s an average over a previous period. Momentum on the other hand, is generally regarded as a leading indicator.
For example: late in a trend, even though price is still trending up, at the same time Momentum can already be losing strength. This is called a “divergence” between price and momentum, and is a signal that the end of the trend is probably near. Here is an example of a divergence between price and RSI:
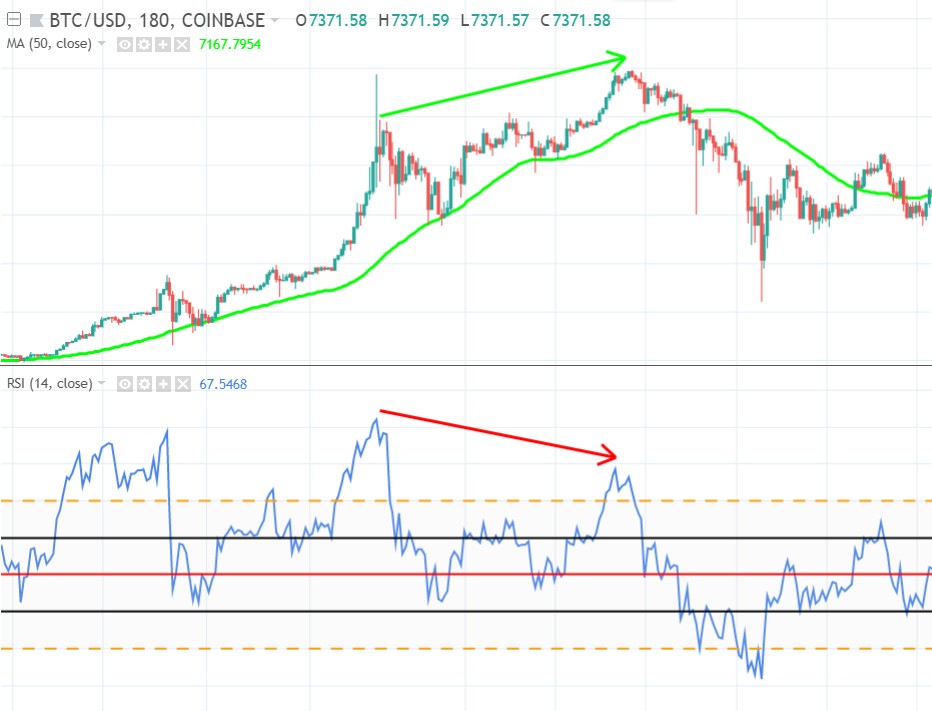
Price makes a higher high (green arrow), while momentum is already making a lower high (red arrow). Next the uptrend ends and price continues sideways. The RSI indicated this before it actually happened. This illustrates why momentum is a leading indicator.
Many traders use the RSI indicator to measure the momentum.
A common mistake among traders using RSI, is they fail to understand the mathematics behind these indicators. They only look for “overbought” (RSI above 70) and “oversold” (RSI below 30) signals. But in reality “overbought” doesn’t mean it can’t be bought anymore, and “oversold” doesn’t mean it can’t be sold anymore. So this terminology is in fact dangerous if taken too literally.
Look at this example, where each time the RSI is oversold, the price drops even further:
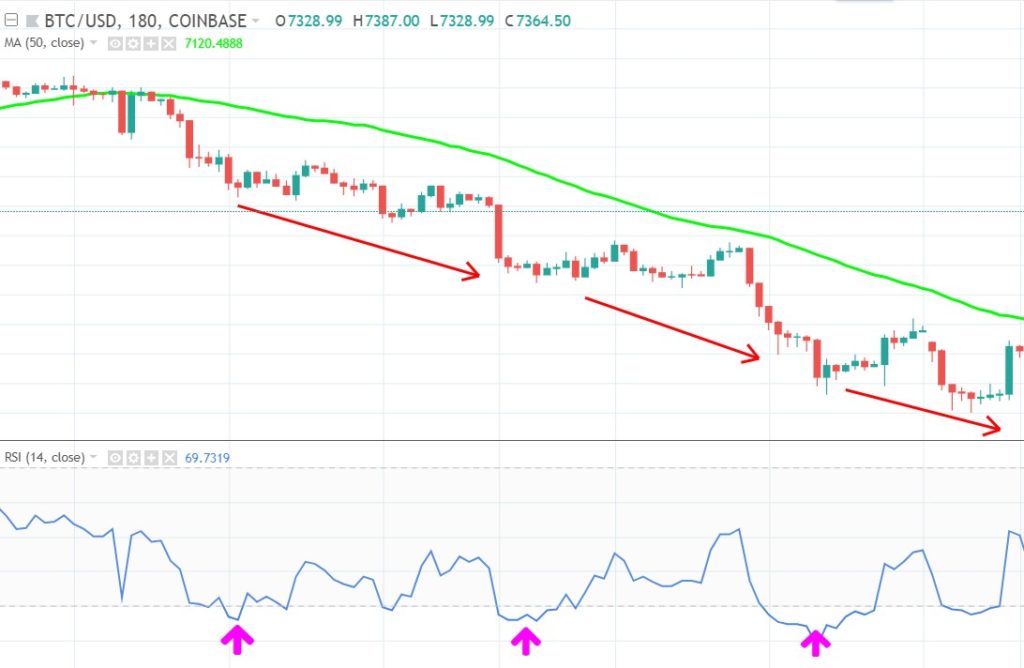
(The arrows show where the RSI is below 30, the red arrows show the subsequent price drop further down)
Many traders assume that when RSI is below 30, that price can’t drop any further, and conclude that it must be a bullish signal. When in fact it is a strong bearish signal. It shows momentum, thus strength, to the downside.
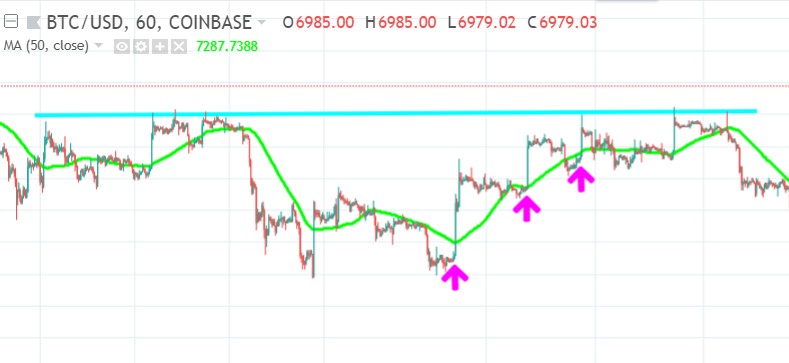
As seen in the previous chapter, I only trade in the direction of the trend. So according to my strategy the above example is not suitable for buying (going long). Each pullback up to the MA50 isn’t really that profitable:
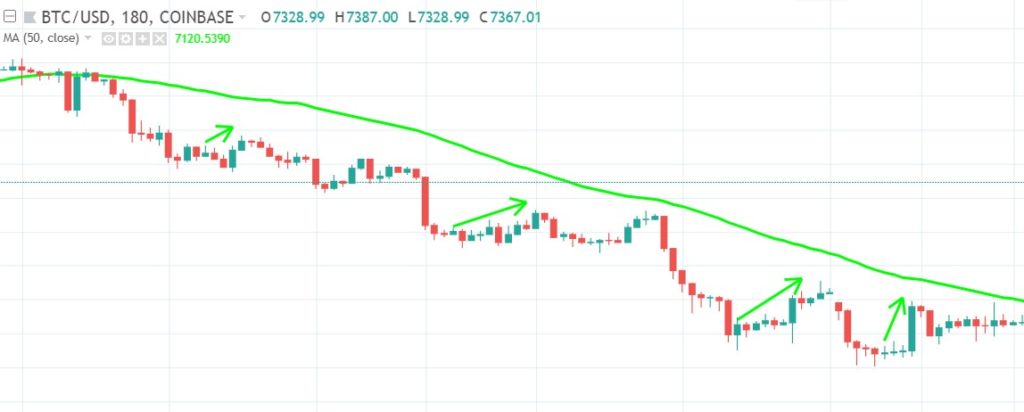
(green arrows are the pullbacks/ retracements)
And if you make one mistake, chances of closing your position in-the-money diminish quickly, it’s very unforgiving to trade against the trend. That’s why I need an upsloping SMA50. I need to trade in the direction of the market.
Go with the flow.
Have the wind at your back.
Let the market work for you.
Back to the momentum. As said, RSI below 30 doesn’t mean “oversold”, but means bearish strength. Just as RSI above 70 doesn’t imply “overbought”, but bullish strength.
The line of the RSI indicator can behave very choppy and chaotic, that’s why I often put a fast MA on it, to smooth things out. Like this:
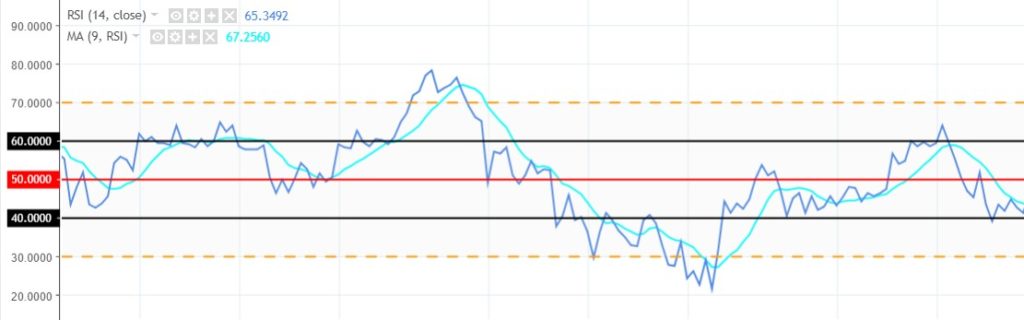
As you can see I also put lines at the 40, 50 and 60 RSI levels.
- RSI is above 50: momentum is bullish
- RSI is above 60: uptrend
- I consider RSI 40 to be the support level in an uptrend
So as long as it stays above 40 in an uptrend, that means that there is strong bullish momentum: a strong uptrend.
In the next example at #1 and #2 you see there is an uptrend, where RSI 40 holds as support, and at at #3 the end of the trend once RSI fails to stay above 40.
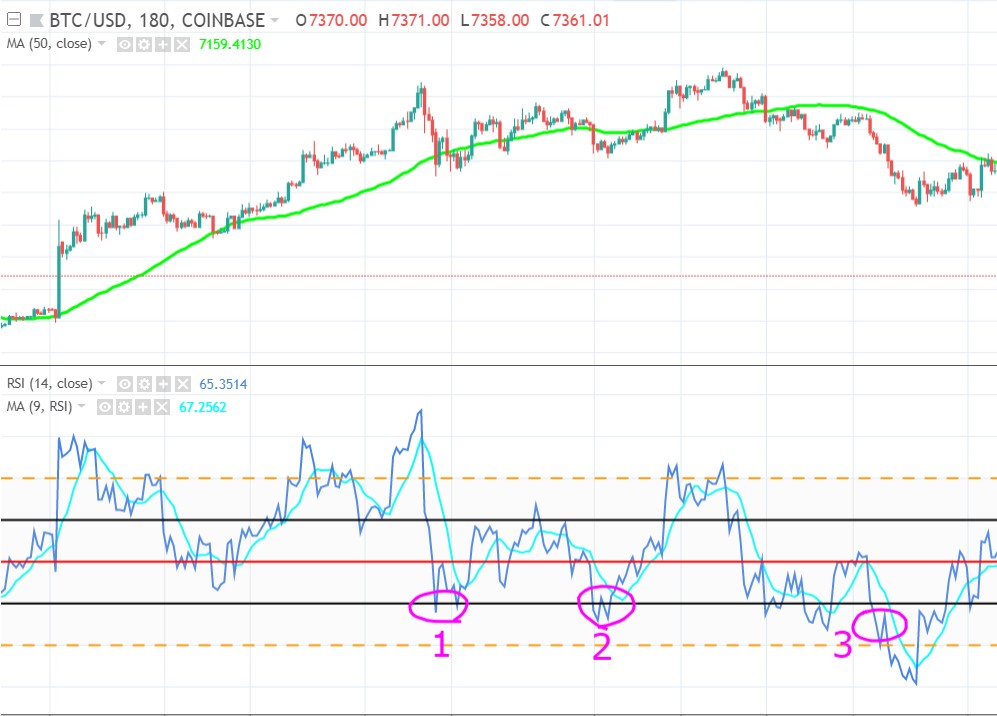
So as long as it respects RSI 40 in an uptrend, that means that there is bullish momentum: a strong uptrend.
So when in an uptrend, the RSI retraces back to 40 and stays above it, that implies a continuation of the uptrend, it’s a bullish signal. But when RSI stays between the 40 and 60 line, hovering around 50, then it is not an uptrend, but the market is moving sideways. In fact markets only trend like 30% of the time, all the other times they are moving sideways. In this situation RSI isn’t bullish or bearish, it’s indecisive until it breaks RSI 40 or 60. That’s why a RSI above 50 doesn’t necessarily mean we are in an uptrend, and we look at the RSI 60 for that.
As market are indecisively moving sideways most of the time, it’s important you know how to avoid them:
- Avoid RSI that is ranging between 40 and 60 and lacks the strength to break out of it.
- I also recognize it by the flat SMA50. I never trade a flat SMA50.
By the way, RSI isn’t really a good indicator of momentum. In physics the formula for momentum stands for mass times velocity, mass in motion.
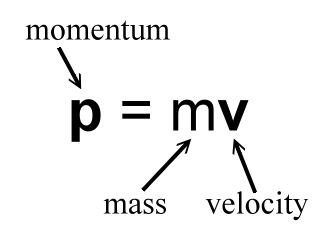
And RSI actually only measures velocity, or rate of change. In markets the mass can be seen as the volume that is being traded. So how do we add volume to the equation? I use a volume indicator next to the RSI indicator. The volume indicator I use is the “On Balance Volume” oscillator or “OBV”. When the RSI indicator shows strength, I want the volume indicator to confirm that strength. So when there is a divergence between RSI and Volume I am cautious.
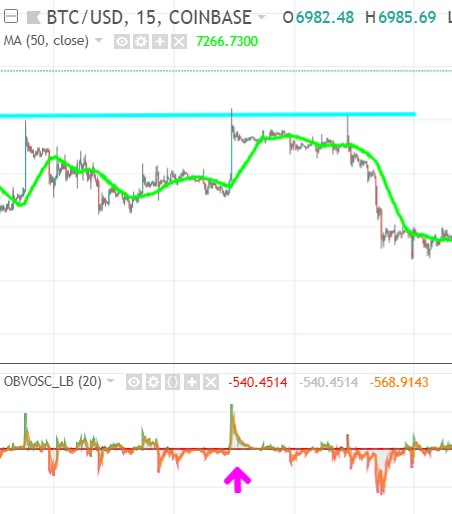
Here is an example of volume confirming the price action, while RSI isn’t yet confident:
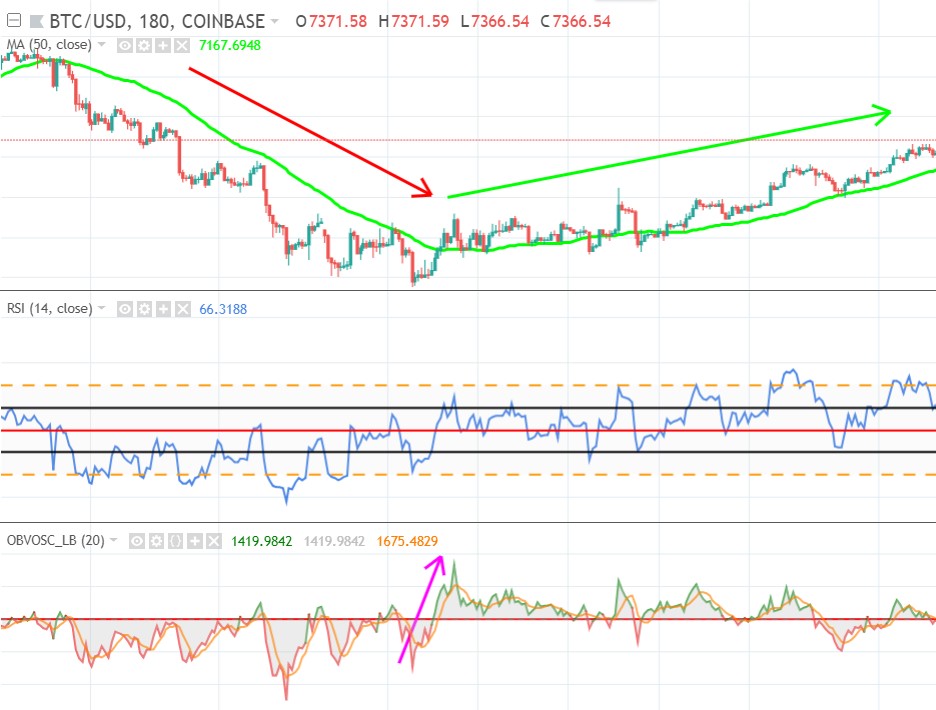
This is exactly what I want to see, a spike in volume while price breaks through a resistance. A break out on strength:
As you can see each spike makes a higher high, confirmed by volume, yet it fails to continue the uptrend, why? When we zoom out, we see it runs into the next resistance line:
It already used its volume to make a higher high, so once it reaches this next resistance it is already exhausted and fails to break it. So lesson learned:
- always look for nearby resistances, and never buy into a resistance
- buy on the breakout, confirmed by volume. So don’t buy each volume spike, use volume spikes as a confirmation of price break-outs instead.
The next volume spike (at arrow) is actually a bearish signal:
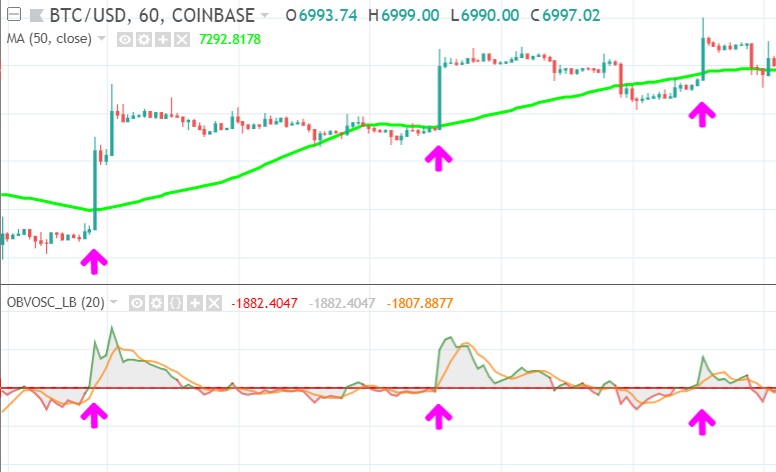
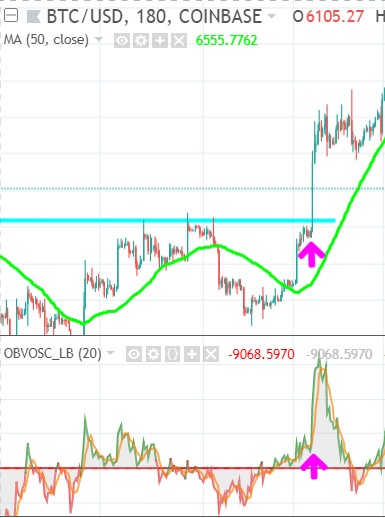
But how does it look when volume does signal a break-out, and price succeeds to break above the resistance level? In that case you see volume increase exactly when price breaks through a resistance:
On the OBV oscillator:
- Volume above zero means buyers dominance
- Volume below zero means sellers dominance
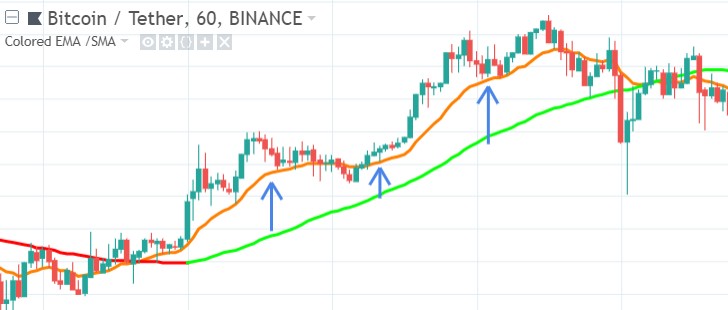
Here I have an example of an uptrend and price making 2 retraces back to the SMA50:
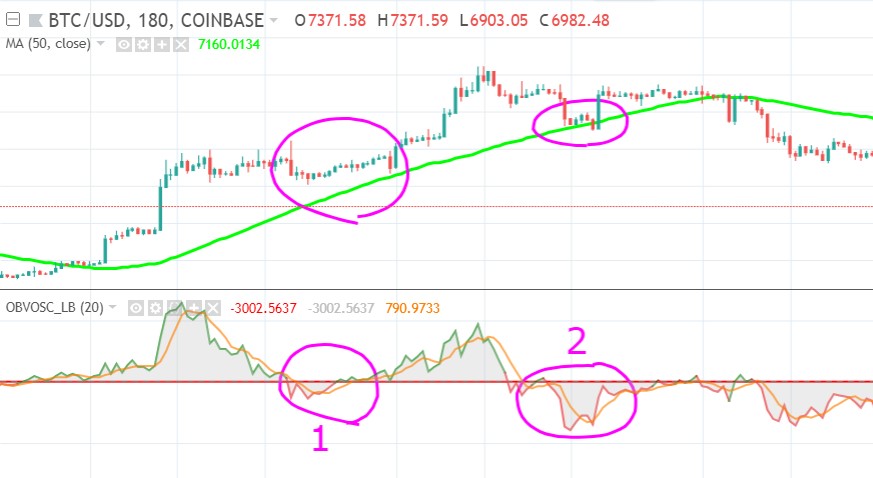
As you can see on the volume oscillator below it:
- 1st retrace: the volume bottoms around zero: buyers and sellers in balance.
- 2nd retrace: the volume bottoms with far less buyers: sellers dominance. And when it bounces back up, it doesn’t reach buyers dominance anymore. So the sellers have taken over: a bearish signal. And subsequently the trend comes to an end.
(Btw. if you look closely, you also see a lower high on the volume oscillator, while price makes a higher high, a bearish divergence).
I avoid situations where price already used a lot of volume only to reach a resistance, chances are high it wil fail to break-out. That’s an exhaustion pattern, and a bearish signal.
In practice my main tool to gauge strength and momentum is the RSI indicator. Next to that I also use a 15 period Exponential Moving Average (EMA15). When the EMA15 diverges up a lot from the SMA50, that means bullish momentum, or strength to the upside, large buy orders are being filled fast.
In a strong uptrend EMA15 often acts as support, when price breaks below this EMA15 support, then price will probably go down and test the SMA50 as support next. Let me illustrate how EMA15 moves away from the SMA50, acts as support and indicates a strong uptrend with the next image:
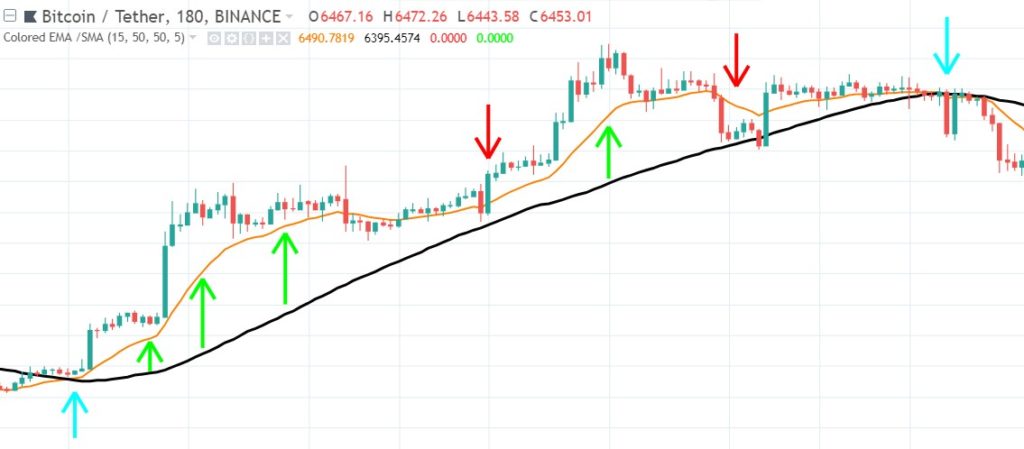
The green arrows show an EMA15 that diverges high above the SMA50. As you see this implies a strong uptrend and price respects the EMA15 as support. But when price succeeds to breaks down the EMA15, then the SMA50 is often the next support zone it runs into, as shown at the red arrows. Often the price action already used up most of its momentum, when it broke below the EMA15, so momentum is already exhausted once price runs into the lower SMA50, and that support holds. When the EMA15 and the SMA50 converge they often form an even stronger support/ resistance zone together, as shown at the blue arrows.
A break through one, means a break through both, and is also a signal of strong momentum.
When buying the bottoms of the retraces I always make sure the EMA15 hasn’t broken below the SMA50.
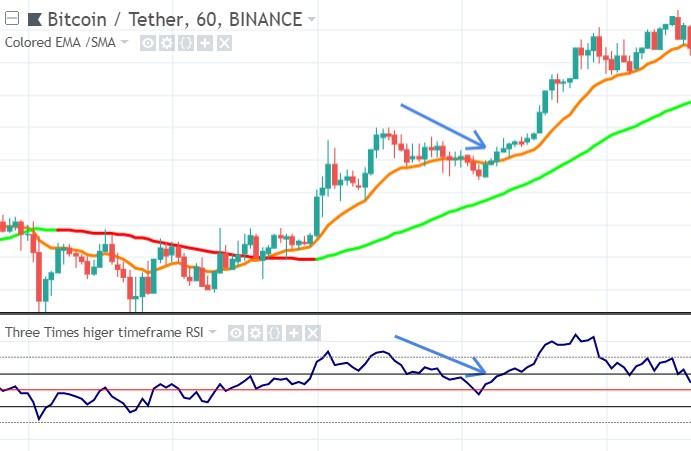
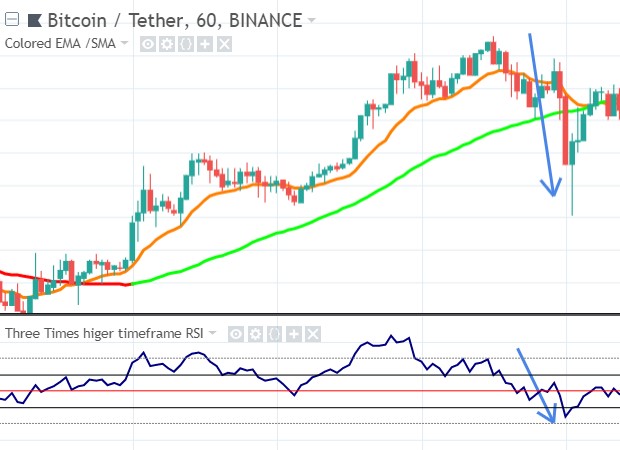
I always combine all steps, to get a complete picture in my head. When you combine the EMA15/SMA50 relationship with RSI, then you will see you get a better picture of the momentum. When you see EMA15 (orange line) moving up and away from SMA50 (green line), that means strength, thus strong bullish momentum:
Price respects the EMA15, when it retraces back to it in the downcycle. At he same time RSI goes from above 60 toward 50 (red line) that it respects as support:
Later on, RSI diverges from price action, showing momentum is already slowing down, a leading indication on what price might do next:
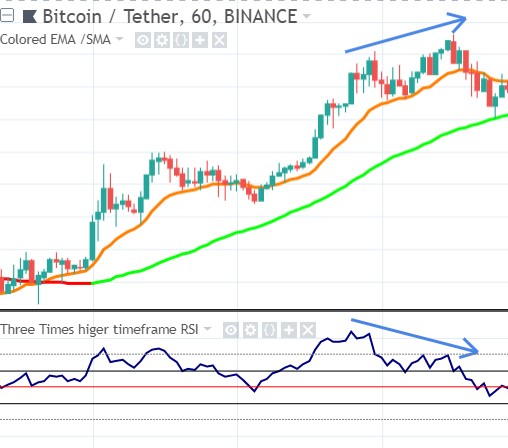
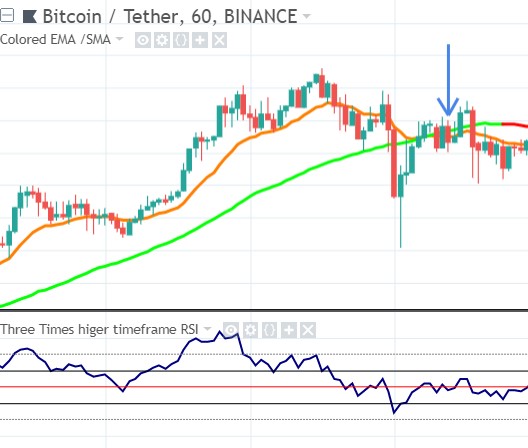
Next price drops below the EMA15 and tests SMA50 as support, but the EMA15 acts as resistance and pushes price below the SMA50. While price is below it, the SMA50 is still sloping up, creating a MEAN-REVERSION setup, and as you can see: price bounces back to the SMA50 afterwards:
But because the EMA15 and SMA50 converged and are now lined up, price needs a lot more momentum to break above SMA50 to continue its uptrend. It fails after several attempts. As you see RSI also failed to get above 50, and remains in bearish (sub 50) territory:
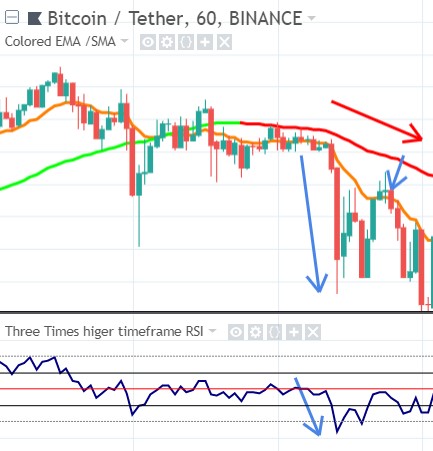
And then price drops below the EMA15, but this time no reversion-to-the-mean setup, because the SMA50 (line turning red) goes sloping down, confirming the downtrend. EMA15 now acts as a resistance and moves away from the SMA50, confirming strength to the downside. RSI broke below 40, the uptrend support, also confirming the downtrend. It also failed to go above 50, which is now its downtrend resistance:
As you might have noticed:
- The first time that the RSI dropped a little bit below 40 (at the bottom of the reverse-to-mean setup) it came from above RSI 60 and it bounced right back to the SMA50 above.
- The second time it got below RSI 40, it dropped down after it failed to stay above RSI 50. This last time it wasn’t a reverse-to-mean setup and didn’t bounce back to the SMA50 at all.
The reason is simple:
- The first time it came down fast all the way from above RSI 60 (super-bullish), so it had a lot of momentum and could bounce back just as fast.
- The second time it had less momentum (it was ranging a bit indecisive around 50) and the subsequent bounce was less strong obviously.
So regarding RSI: don’t look at the RSI numbers such as RSI 40 as static borders, but always place them in context, and look where price came from.
You have come to the end of this chapter. To summarize this:
- I only trade strong trends: with momentum and volume behind it.
- In an uptrend RSI has to break above 60 (and respect 40 as support).
- Volume has to confirm price, we want to buy into strength.
- I use EMA15 as a secondary tool to gauge the strength of the trend. I prefer to buy when EMA15 is above SMA50
This was just the second step. Still 5 steps left to take before we can make a balanced trade decision. And remember: Never skip a step, or you might fall.
Keep it simple!
Click below to go to the next chapter 3: Chart Structures