Big Wins and Small Losses
There are two instances where we exit a trade. When we take profit (TP) or when we stop-loss (SL). But how do you know it’s time to exit your trade? In the previous lecture about Risk Management you already learned a popular trading rule: Big Wins & Small Losses = Profitability.
Experienced traders know this, keep your losses small, and let your winners run.
We can learn a lot from the Forex market, as this market consists of many experienced traders. A major Forex broker shows us these results:
Source: www.dailyfx.com
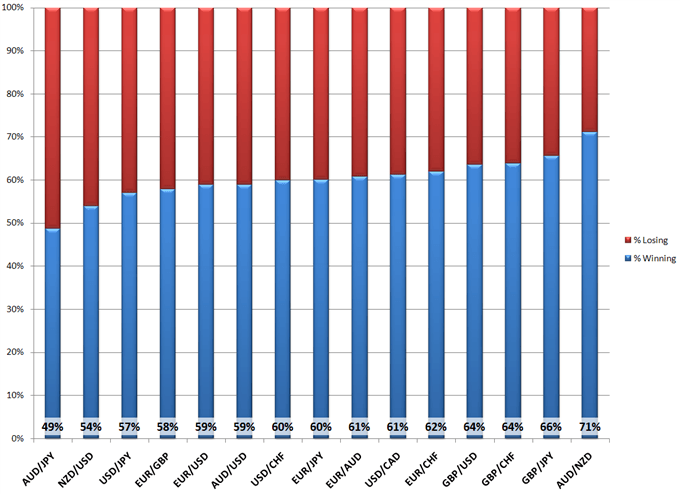
“The above chart shows the results of a data set of over 12 million real trades conducted by clients from a major FX broker worldwide in 2009 and 2010. It shows the 15 most popular currency pairs that clients trade. The blue bar shows the percentage of trades that ended with a profit for the client. Red shows the percentage of trades that ended in loss”.
As you can see in this chart, traders are correct more than 50% of the time, with the most popular currency pairs. So you would think that most traders would be profitable trading Forex, right? Nope! Most Forex traders are actually NOT profitable.
To understand why, please take a look at the next chart:
Source: www.dailyfx.com
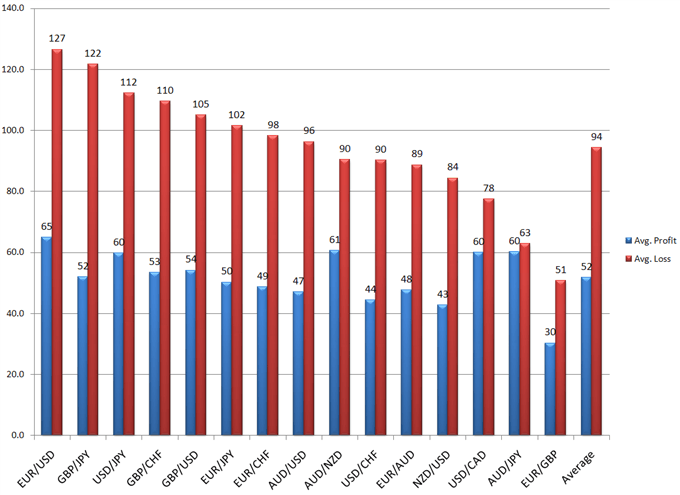
“The above chart says it all. In blue, it shows the average number of pips traders earned on profitable trades. In red, it shows the average number of pips lost in losing trades. We can now clearly see why traders lose money despite bring right more than half the time. They lose more money on their losing trades than they make on their winning trades”.
This is exactly what the “Trade like a Casino” item in the previous lecture was all about.
Rule: always seek a bigger reward than the loss you are risking.
This is called a “risk/reward ratio” like we discussed earlier. What ratio you should use depends on the type of trade you are making. Always use a minimum ratio of 1:1. That way, if you are right only half the time, you can still break-even.
- With high probability trades such as my mean-reversion trading strategy, you will want to use a lower ratio, perhaps between 1:1 and 1:2. This prevents getting stopped out too early, as mean-reversion trades tend to return to the mean frequently anyway (a high win-rate), and offer a relative low potential profit per trade (as compared to trend trades for example).
- For lower probability trades, such as trend trading strategies, you will want to use a higher risk/reward ratio, like 1:2, 1:3, or even 1:4. This is because trend trades offer a bigger potential profit, than for example mean-reversion trades, but at the same time trend-trades have a lower win-rate. So you leave more room for the profit to grow along as price trends higher and higher, and at the same time take in to account that ending up in a (strong) trend is a more rare event.
So the higher the risk/reward ratio you choose, the less often you need to correctly predict market direction in order to make money trading.
Many forex traders that are wrong about the market’s direction, are still profitable in their overall trading. How? Because they practice good money management: they cut their losses asap and let their profits run.
The importance of money management, and thus the usage of stop-loss and take profit orders, is illustrated in the following chart:
Source: www.dailyfx.com
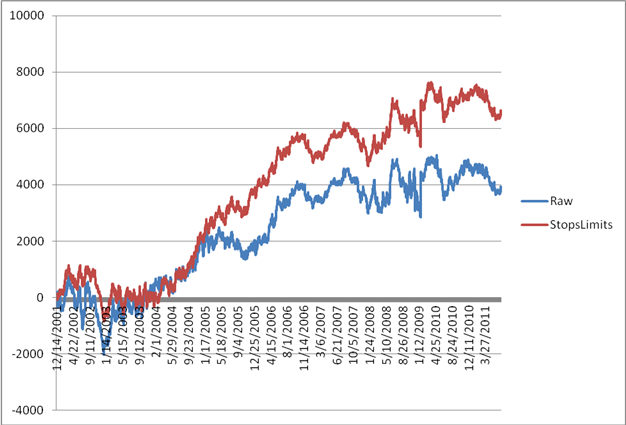
“The 2 lines in the chart above show the hypothetical returns from a basic RSI trading strategy on USD/CHF using a 60 minute chart. This system was developed to mimic the strategy followed by a very large number of live clients, who tend to be range traders. The blue line shows the “raw” returns, if we run the system without any stops or limits. The red line shows the results if we use stops and limits. The improved results are plain to see.”
Rule: Trade crypto with stop-loss and take profit set to a risk-reward ratio of at least 1:1.
Set your targets in advance
As said, it is natural for humans to want to hold on to losses and take profits early. It is the main reason many traders fail to be successful. We must overcome this, and remove our emotions from trading.
The best way to do this is to set up your trade with stop-loss and take profit orders from the beginning, and to stick to it. Once you set them, don’t touch them again.
You need to know when you are in a losing trade. As a technical analyst you should already know where your trade goes wrong even before you enter the trade. So the technical reason we enter a trade, always has a point where it is no longer valid.
Many new traders built their strategy upon their entries. But it is actually more important to focus on your exits (from a risk-management perspective – maybe the most important perspective).
So you need an exit when you’re right, and when you’re wrong. When you go long, and price goes up, then you’re ok, the trade will often take care of itself as it runs towards your take profit target. But in case a trade turns against you, you should also know where your stop-loss target is. That’s at the price level where your technical analysis is proven wrong. It’s the level where you no longer want to be in the trade. It can be because your analysis was wrong, or the market has changed direction, because remember:
Anything can happen anytime in markets – Warren Buffett
Rule: You need to decide where the stop-loss level is, before you enter the trade.
In the previous chapter you learned how to manage your risk using Position Sizing. That is also set in advance, before entering the trade. Now you know you should also determine the level where you cut your losses short in advance.
So after you have entered the trade you can actually sit back, relax, and let the trade play out. Btw. this is also very healthy from a psychological perspective.
You need to do your own analysis, plan your own trade, trade you own plan, and manage your risk. No one is forcing you to get on a trade. Take your own responsability. And remember: You will get losing trades. Don’t try to avoid losses, or you might risk losing all.
Rule: Don’t trade with fixed SL or TP percentages. Don’t force your static SL/TP levels onto the market, but let the market decide where they should be. Use technical analysis for this. There are no magic numbers for this, again no holy grail.
Where to exit?
So as said before, you should determine: at what level will the reason, you want to enter the trade, no longer be valid. Here I will focus primarily on trend trades (a more in-depth look into these trades in the trend trading bonus chapter).
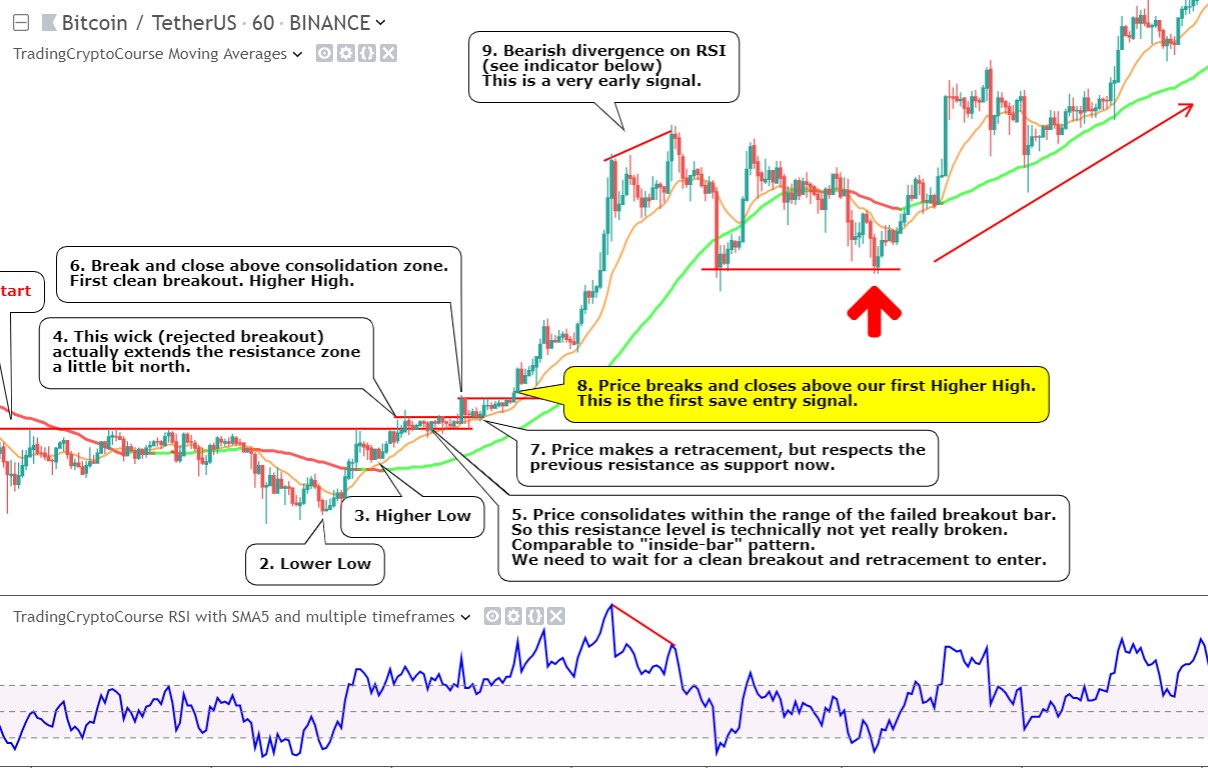
In the next chart I show you a simple chart analysis, based on price action, moving averages and RSI, to look for take profit exits:
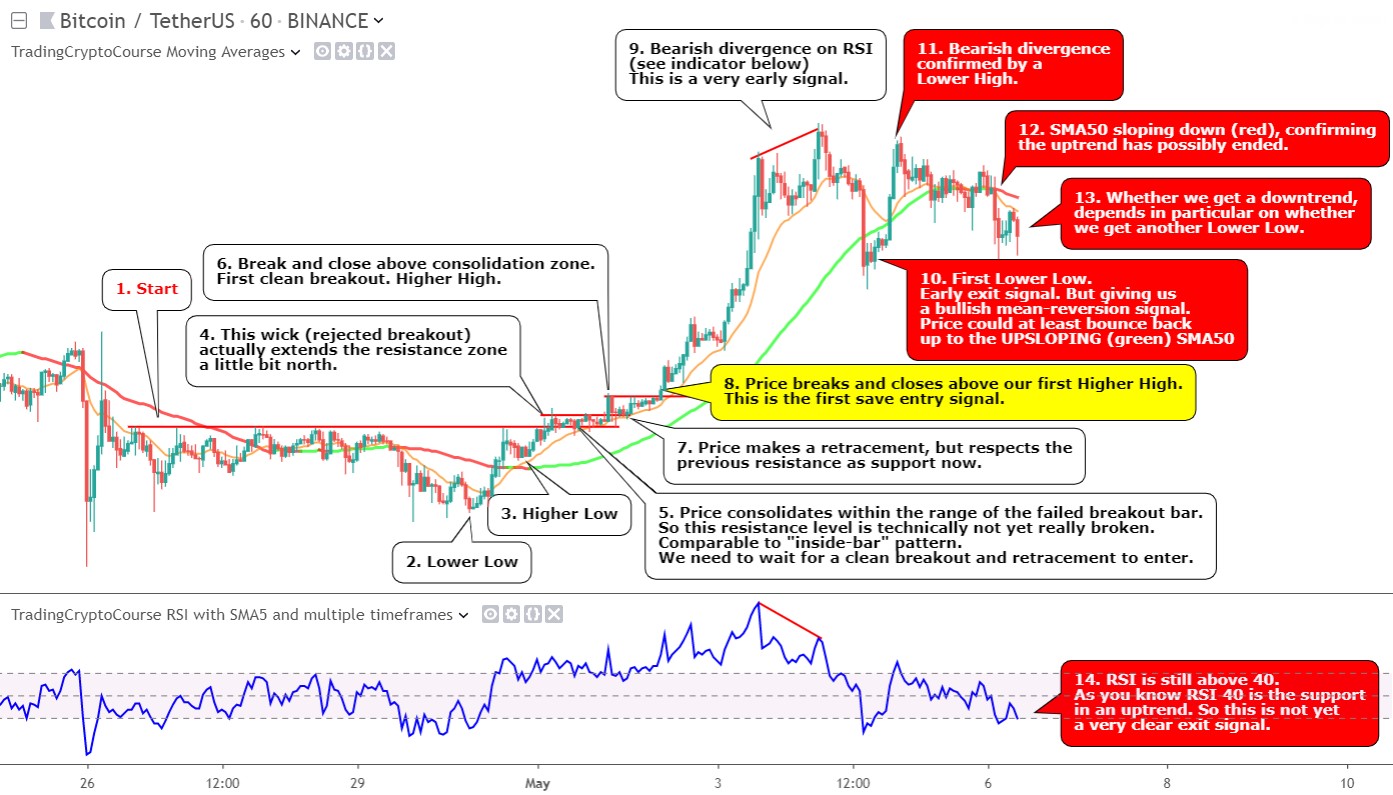
Here I am looking to enter a new trend early, but not too early.
At 8. I get a safe entry opportunity. At 9. I get a bearish divergence, and I could take profit. I could also wait for price to make a lower low, like at 10.
But by then it also meets the requirements for a potential mean-reversion trade.
Price subsequently bounces back up towards the SMA50 and beyond. Mean reversion targets are often just below the SMA50 (also depends on the position of the EMA15, more about this in the next bonus lecture). This mean reversion target could also have been a good exit for this trend trade.
So we already got 3 exit signals, but as you see at 14, the end of the uptrend is not yet confirmed by the RSI.
So next the previous low hold as support (at red arrow) and the trend continues to run up:
As you will see in bonus chapter 2, I prefer to enter a new trend, after the first higher high gets a correction and price manages to break and close above that high again.
So where would you put your stop loss order? Where would the reason we entered this trade no longer be valid.
Let’s take a closer look at this example. The resistance zone is actually extended a couple of times, before price manages to break and close above it. If price falls back below these extended resistance lines, that could mean that price will continue ranging sideways, but not necessarily the end of the uptrend. For that it needs to break below the original resistance line:
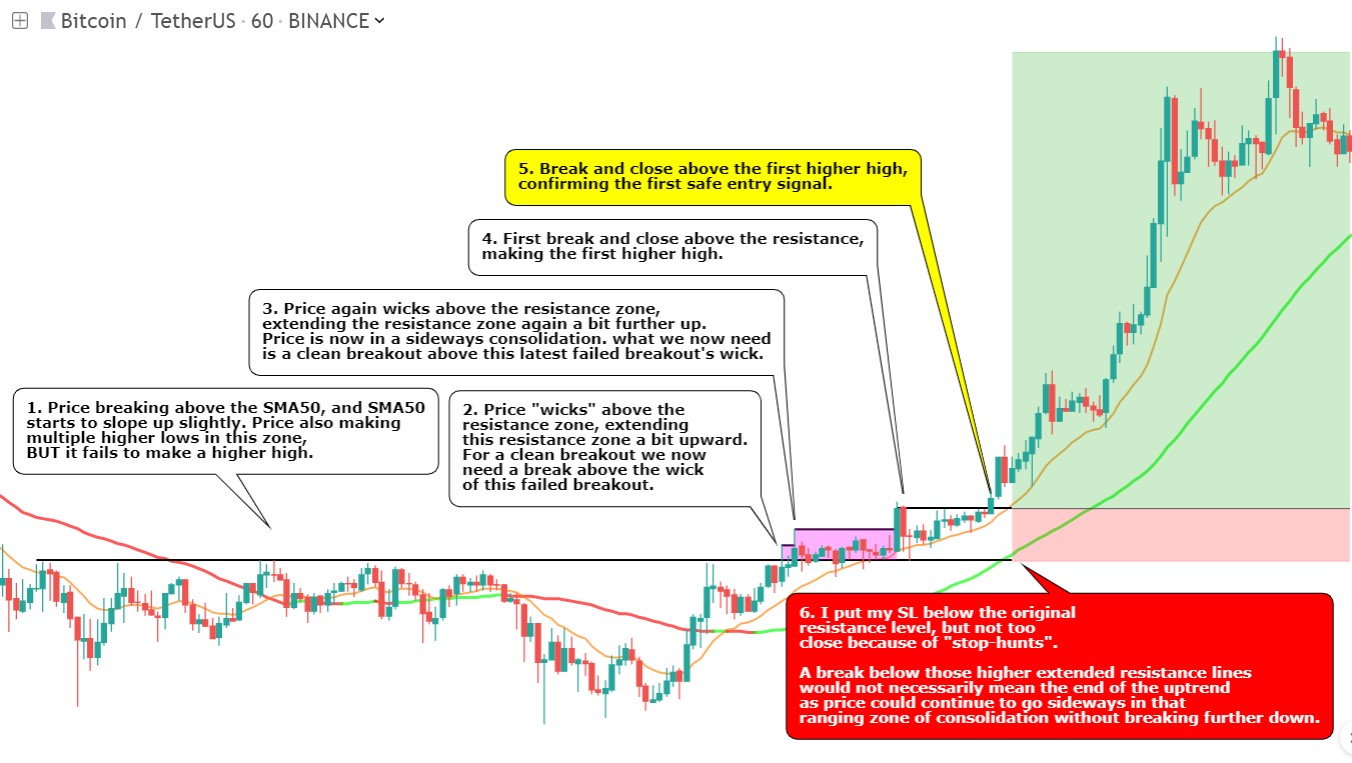
So that is where I place my SL in this case (actually even a bit lower, below the lowest wicks of this consolidation zone, because of fake-outs / stop hunts). Btw. just look at that amazing RR ratio. That is why I like trend trading so much, you really have the opportunity to let your winners run!
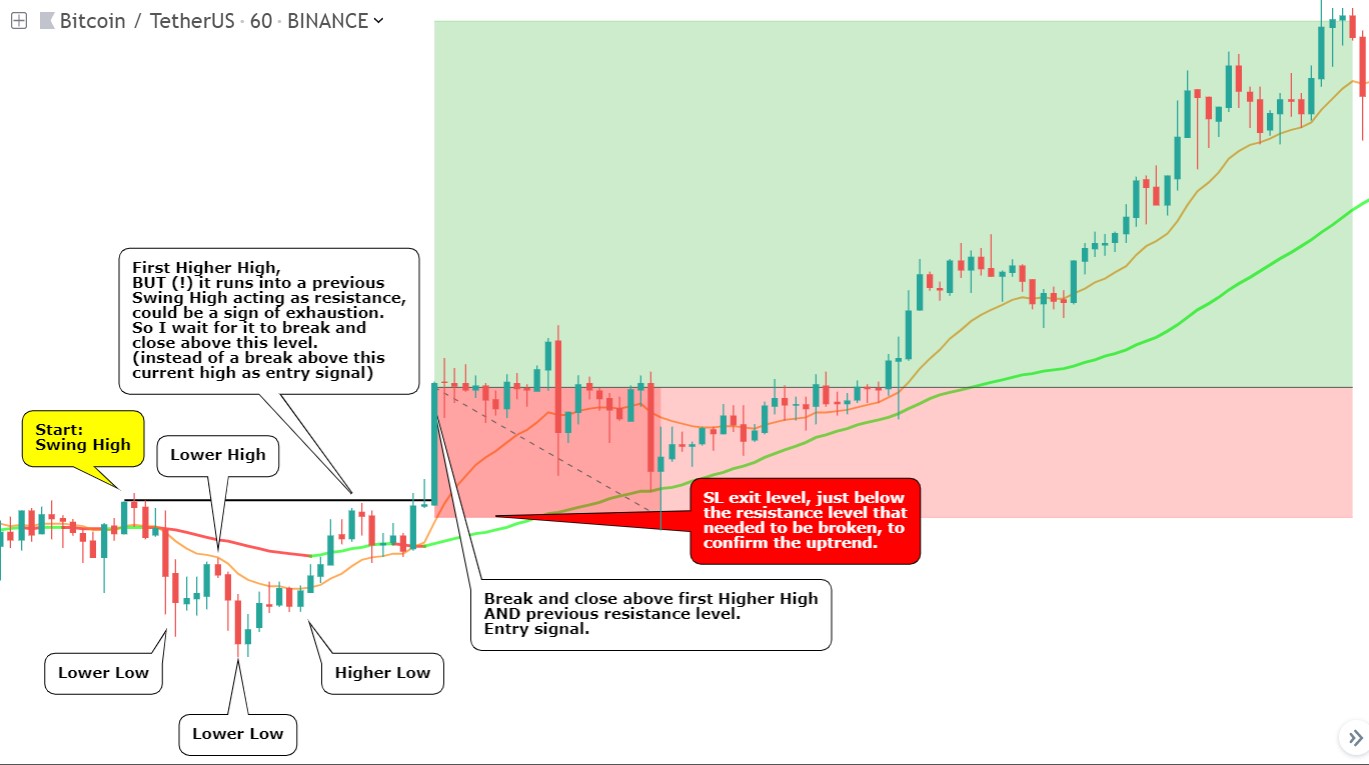
Below another example. I have added potential exhaustion to show you how I determine these SL levels in real life:
Remember that a stop loss order is simply an order that closes your position at a specific price. You control risk by limiting loss. SL orders are usually market orders. This means that when there is no one at that price, that you could also be closing your position for a worse price: “slippage”. This is why you should only trade coins with high (enough) volume.
Near or Far Stop Loss? (important)
In the above example the SL was placed quite close. You can place the SL near or far. Normally my SL exit level (when going long) is just below the latest support level (candle low) before entry, or the major resistance-turned-support, that was the critical treshold in the onset of this trend. When it is broken this means this level doesn’t hold as support, and the motive behind this trend is lost. The trend might be over even before it really begun.
You may ask, what is close and what is far? Let me explain:
- Nearby SL order: When a coin breaks above a resistance, then you place your SL just below that resistance.
- Far SL order: When a coin breaks above a resistance, then you place your SL below the (first) support level below that resistance level
Both these examples are applicable to a breakout of a consolidation, or when you get the first “higher high” in a potential uptrend.
First Attempt?
Where you place your SL also depends on your risk appetite. As a trader you encounter false breakouts often. Many times a coin makes an initial fake breakout, before making the real big breakout. Or the real breakout never happens at all.
- So when the breakout is the first attempt, then you might consider using the nearby SL.
- And when it’s the second attempt, you might consider the far SL. The chances increase it is a true breakout, so it is saver to leave some more room for a pullback.
SL Below Support Level
You should never put a stop loss at a random level! What is the ideal place?
- A place that leaves some “room to breathe” (the market is allowed to fluctuate within its normal volatility), while it moves in your direction.
- A place that gets you out of the trade once the market turns against you.
As I have said before, the most used method for stop loss placement (when going long) is to put it below a swing low support! A break below a swing low means that this support level is no longer holding price up. You always want to trade in the direction of the trend (the trend is your friend, remember), so the swing lows should move up: you want to see a sequence of higher lows (and highs).
Exit Mean-Reversions
In the next chapter you get a more in-depth look at mean-reversion trades. But how to set your stop-loss on these mean-reversion trades? Most mean-reversion trades return to their mean, or at least very near to it. But sometimes the market changes and doesn’t return to the mean at all (or only after the mean has already fallen below your entry level). I try to avoid this by only trading mean-reversions in an early trend. But of course there is never a 100% guarantee this will work out. The market can do anything at any time.
In the next example you see a healthy mean-reversion on the left (earlier in the trend), and a mean-reversion that turned out bad later on (at the second red arrow).
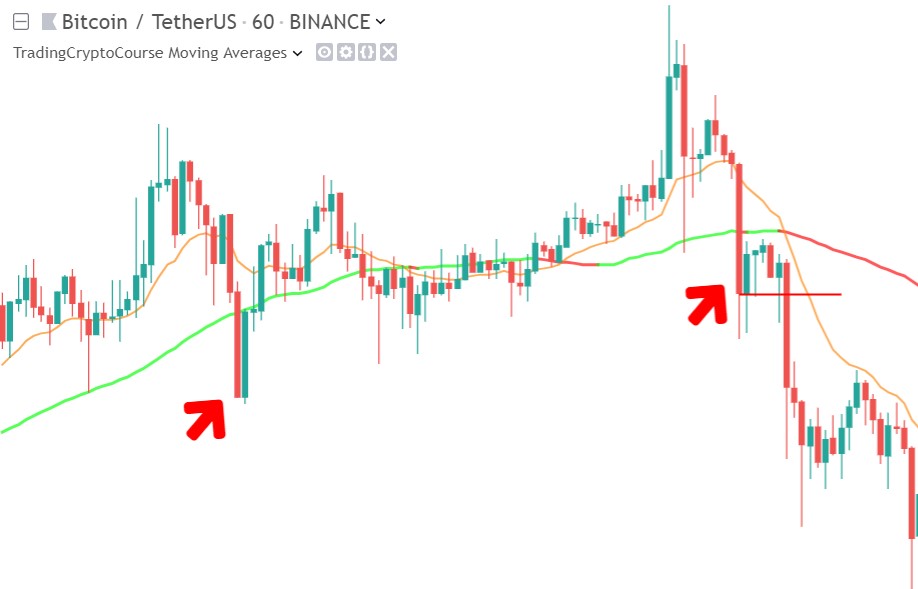
(red/green line is SMA50, orange line is EMA15)
You see that this “bad” mean-reversion opportunity didn’t manage to reach the SMA50 (red/green) or EMA15 (orange) at all. When going long I prefer to put my TP just below the nearest of these lines.
But moving averages are dynamic lines. So how can we set our TP in advance, when these lines are constantly moving?
When I enter a mean-reversion trade I set my SL based on technical analysis (mainly static support levels). As said, the TP is based upon the SMA50 and EMA15. I look for a RR of at least 1:1. As the market and thus the ma’s evolve I adjust the TP accordingly. But when the TP reaches the level where the RR becomes less than 1:1, then the trade has lost its reliability, from a risk management perspective. In my opinion it is then time to exit the trade asap (preferably at break-even), instead of waiting for it to reach the SL. As the reason to be in the trade is now gone (we only enter trades with an expectancy of RR 1:1 or higher, and each time I adjust the TP is like I “re-enter” the trade). The risk is now higher than the maximum reward you can get out of this trade.
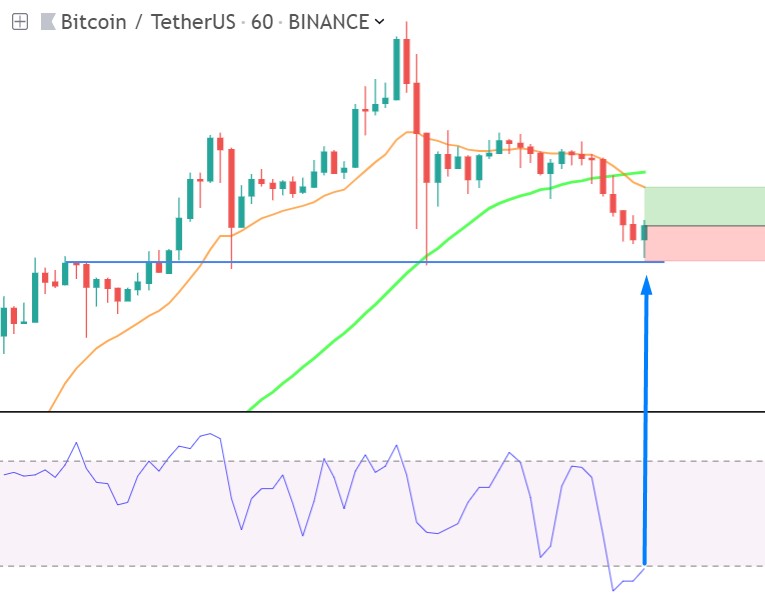
Here I show you an example of an entry into a mean-reversion trade, and how SL and TP exits are based upon support levels (blue lines) and SMS50 (green line) respectively:
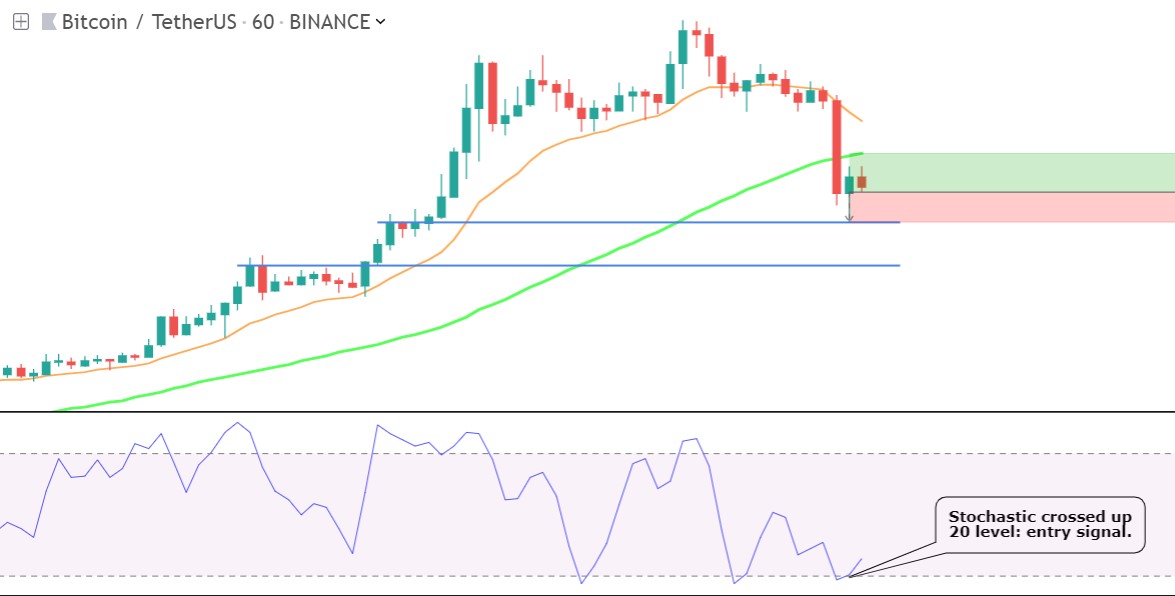
The RR is above 1:1, so that’s just good. But when price drops below the support level and triggers our SL, then the mean-reversion opportunity might still be valid, as the SMA50 might still be sloping upwards. In such case price is just making a lower low before attempting a return to the mean. The reason you would want to exit such trade is that the RR is now lower than 1. Your risk is higher than the potential reward. You could add to your position to improve your RR and lower your break-even level.
But ONLY if the SMA50 is still sloping upwards. This is the only occasion in which I add to my positions. In any other case, I strongly reject adding to losing position.
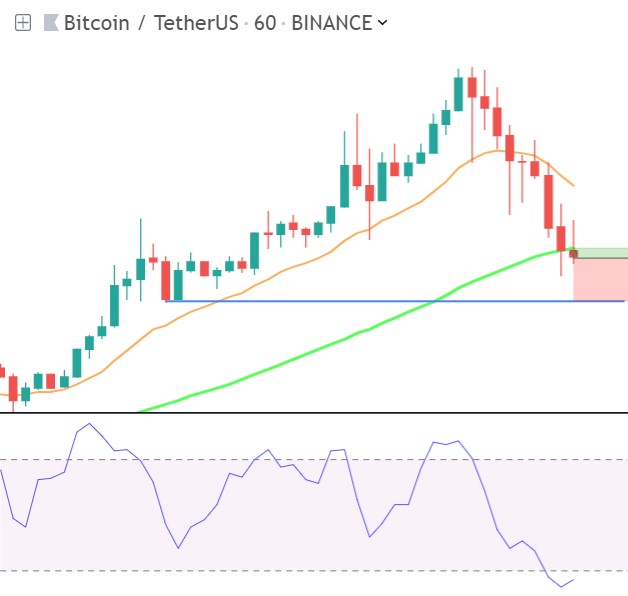
Here another mean-reversion example, but now targetting the lower/ nearer EMA15:
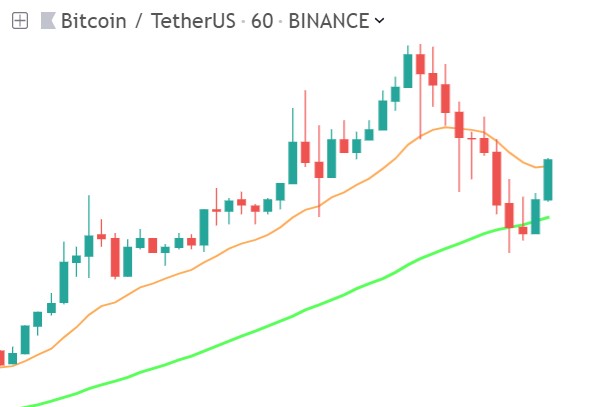
Below an example of a mean-reversion opportunity in a strong uptrend, but it has a too small deviation from the mean, giving an unhealthy RR:
But even though this is a very tempting opportunity, because the uptrend is very strong (the SMA50 is steep and the EMA15 is way above the SMA50), it is better not to take this trade, because when price does drop further down towards support, then your chances diminish very quickly. Better safe than sorry. So please don’t feel sorry when you see how price jumped up next:
If you do take these kind of risks, and make these unhealthy RR trades on a regular basis, then the odds won’t be in your favor in the long run (remember the casino’s strategy).
These mean-reversion trades are an example of high-winrate trades. When trading these high-winrate trades and backtesting different settings, I realised that when I improved my risk-reward rate (by setting a tighter SL and/or wider TP ), then my winrate deteriorated proportionally. So I realised that risk-reward and winrate are actually two sides of the same coin. A closer SL will be hit more often statistically. Give trades less room to breathe, and the more trades will die.
Many traders claim the “holy grail” in trading is to have a high winrate, while having a high risk-reward ratio at the same time.
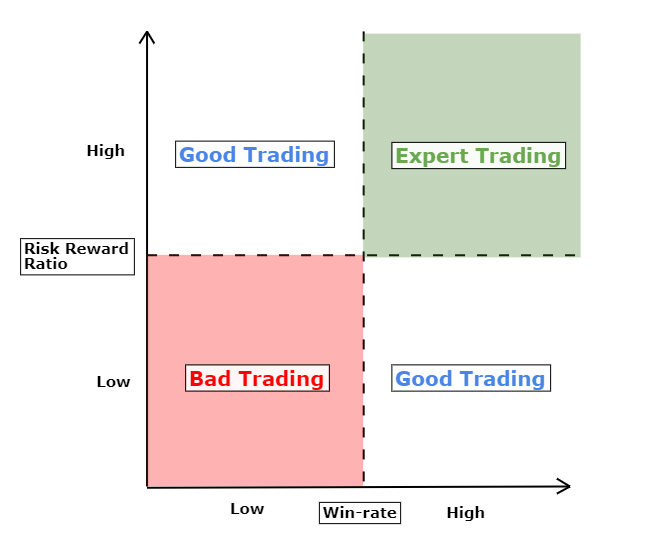
In my experience one of the most important habits of professional traders is the avoidance of over-trading. After finding the (high win-rate) opportunities with the highest probabilities (using a system like our 7-step method) pro traders only trade those setups with the healthiest risk-reward ratios. In my experience this is the most reliable path to the “Expert Trading” quadrant in the above matrix.
To less experienced or novice traders these habits are sufficient to be profitable:
- Get an edge over the market, so you win more than 50% of your trades. This can be achieved by a solid trading system, for example based on my 7-step method (although I know there are many expert traders that are even profitable with a 30% or lower winrate).
- Your risk-reward ratio should remain above 1. The higher the better, but keep an eye on your winrate.
- Don’t over-trade (have patience).
Stop Loss Alternatives
Although I prefer to put the stop loss below a swing low (when going long), there are some alternatives. I think it is good to know some for your general development as a trader.
- Many traders use Fibonacci levels to determine SL levels.
- Volatility is a very common stop loss indicator. For example the ATR (Average True Range) indicator shows you how much price typically moves over a period of time. So traders use this to set their SL’s outside of these bands of “normal” volatility fluctuations.
- When you are trading with technical indicators, then you can use the same indicators to get exit signals. The 7 step method that provides me with entry signal, can also be used to look for opposite exit signals. More about this next.
Exit Trends in 7 Steps
In trades like mean-reversions the TP level is obvious. But in many other trades, the TP level is much less obvious. These trades often have a lower win-rate, but a higher upside potential. Trend trades are a good example.
Some traders trail their profit at a particular percentage or based upon some measure of averaged volatility, for example by using an ATR trailing stop.
Although the avg. volatility aproach is very good and widespread, I prefer a more discretionary aproach. Just like when I enter a trade I also use technical anlysis to find my exits. I use my 7 -Step strategy, but this time I look for the opposite signal.
First I look for the nearest major support and resistance level, to determine if the trade has a healthy RR expectancy of at least 1:1. When I decide to enter the trade I set the SL at the designated level, and wait for the trade to play out. I don’t set a TP order in advance, but watch all 7 steps continuously, in order to sell as high as possible.
Here I show you an example of how I use the 7 steps as exit system in a trend trade:
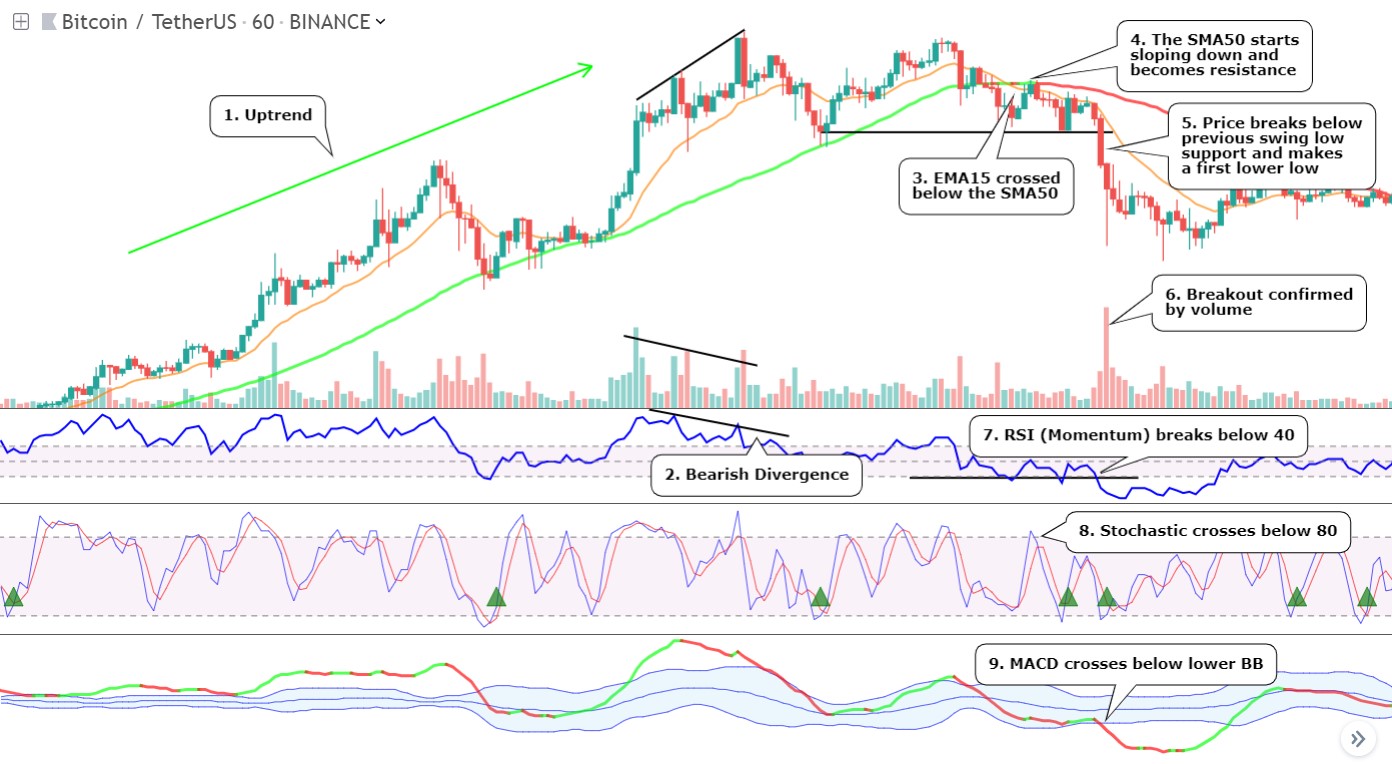
- Trend: We are in a strong uptrend
- Momentum: Bearish divergence, an early leading signal that the trend is losing momentum. At the same time volume is also consolidating.
- Trend: For the first time in this trend, the EMA15 crossed below the SMA50, a bearish signal.
- Trend: Next the SMA50 starts sloping down, a bearish signal, could lead to a trend reversal.
- Market structure: price breaks and closed below previous swing low support level, and makes the first lower low.
- The break below support is confirmed by increased volume on breakout.
- Momentum: RSI breaks below 40, the uptrend support level.
- Timing: The stochastic crossed below 80. First cycle high that doesn’t reach above the SMA50 anymore.
- Timing: MACD crossed below its lower Bollinger Band, another bearish signal confirming we are in a downcycle..
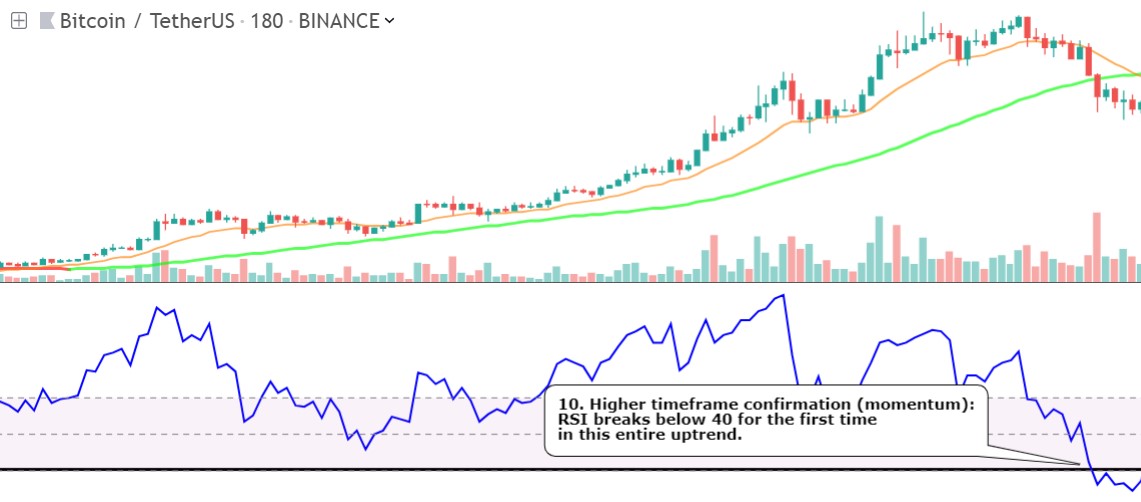
10. Higher Timeframe: Momentum on a higher timeframe chart confirms the bearish signal, as the RSI drops below 40 (uptrend-support level) for the first time in this entire uptrend.
11. Depth Chart: the breakdown of the uptrend was confirmed by the depth chart turning bearish at the same time.
This is the Bitcoin chart, so I didn’t need to look at the Bitcoin chart for extra confirmation.
“Zero Risk” Exits 😮
In trend trades, and other trades with high profit potential, I often use my more advanced “zero risk” exit strategy. For my “zero risk” exit strategy:
- I set my RR at 1:1, so my SL is at the same distance as my TP.
- But when price hits the TP level I only exit 50% of my position.
So in case price next fails to go any higher and falls back to my SL level, then I close the remaining part, and the whole position is closed at break-even, “zero risk”. But in case price does go higher, you have infinite profit potential. So to the downside the risk is limited to zero, and to the upside you have unlimited profit potential. Just imagine a profit potential of 0:1 or even 0:5. Wow! Imagine riding a strong trend right from the start without any fear. Knowing how to take the fear out of a trade is one of the most poweful assets a trader can have.
Of course this zero-risk strategy can only be executed when the market reaches the 1:1 TP level first. In case it first reaches the SL, then you can’t turn it into a zero-risk trade obviously.
Simple zero-risk rule: If you use a 1:1 RR and are able to exit the first 50% of your position at the TP level, then the rest of the trade is totally risk-free.
Although mean-reversion trades have less upside potential than most trend trades, I still use my zero-risk approach on it regularly. As you know, a RR of 1:1 is very normal for mean-reversion trades. So when the chart shows room to grow to the upside, why not exit 50% when the TP level is hit first? It might feel like you are risking/ wasting a perfect (but small) profit, for break-even. But remember how those Forex traders had a high win-rate, but were still losing money because of those same small winning trades.
When trading mean-reversions (or other trades) at a 1:1 RR, you have to keep in mind that slippage can cause your avg. losses to turn out bigger than your avg. profits. So it’s always good to aim for a higher RR. The zero-risk aproach can be a helpful tool to achieve this.
You should never move your entire position’s SL to break-even though. Then the SL level no longer makes sense from the perspective of the initial technical reason you entered the trade. A trade needs room to breathe, if you take this away you could potentially close a winning trade too early. This turns the odds against you in the long run.
My mean-reversion trades are the exception to this rule, as these trades’ TP is based on moving averages, and has to be adjusted constantly. This can result in an unreliable RR ratio, while already in the trade. Exiting such trades break-even is a good choice in my experience.
Final Word
These last two lectures were all about money management. Not only about managing the risk of a single trade, but in relation to managing the risk for your total capital over time. These were actually the most important trading lessons you could get.
Many (new) traders take the “dumb” approach: an endless search for the perfect entries, indicators, and holy grail trading system.
And that is what many “gurus”, trading courses and trading systems promise. The “dumb” traders want to be spoonfed the perfect entries and exits. And all these gurus show them charts with perfect entries and exits, saying things like: “My indicator is all you need to be profitable”. It is the stuff that sells, but not the stuff that necessarily makes you money. People who share this kind of stuff on Youtube, Twitter or Facebook do not have your best interest in mind. They have their best interest in mind. Don’t be fooled!
Although this course is also about a trading system that promisses you good entries and high win-rates, my course and trading style are actually different. Just look at these last two lectures about money management. My success as a trader is just partly due to my successful trading system. I would not have achieved this success without the strict use of proper money management. In hindsight I can even say that it was the key to my success as a trader. Funny how the thing that was the key to my trading success is not the “sexy” stuff that sells courses 🙂
Congratulations, you made it this far!
At the end of the course I have added 2 very interesting bonus chapters.