Next we are going to look at a higher timeframe chart to get confirmation. Higher timeframes dictate the dominant market direction. But at the same time it spans a wider range, making it harder, therefore, to get precise trading signals. Often the lower timeframes are used to refine the higher timeframe structures, and facilitate better, more precise, trading signals.
But only looking at the lower timeframes is like tunnel-vision. Like in real life it is always good to know the bigger picture. Looking at higher timeframes gives less signals, because higher timeframes move slower, but the signals are often more reliable. It is not really about catching the most opportunities, but only the ones with the highest probability. Quality over quantity.
When both the lower and higher timeframes confirm a trade signal, that trade will have a higher probability.
For example: there is one group of traders that solely uses the 1 hour chart, and there is another group that solely uses the 3 hour chart → when both timeframes confirm a buy signal → a larger group of traders see that signal → and a larger group will trade based on that signal → leading to a higher probability that the market will be moved by their trades (bigger self-fulfilling effect).
Btw. you can use higher timeframes to get a better view at how price interacts with the support/resistance levels we talked about in the previous chapter.
Here you have an example of a previous resistance level that is tested a couple of times and price seems to slightly break through it:
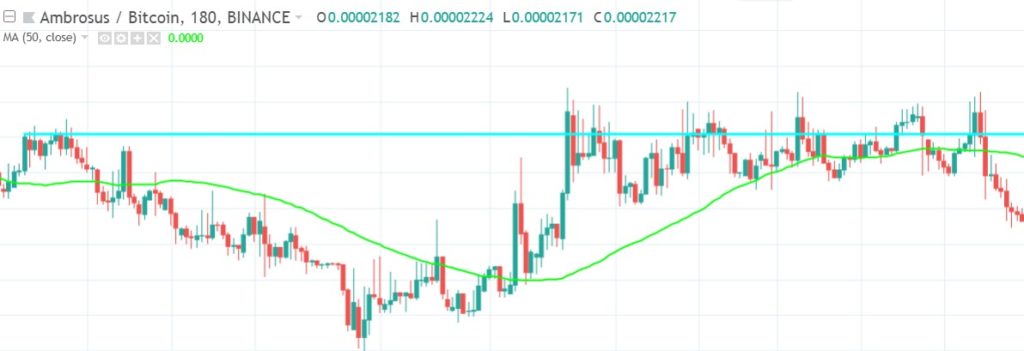
But in the higher timeframe it’s clear that price didn’t even close above this resistance:
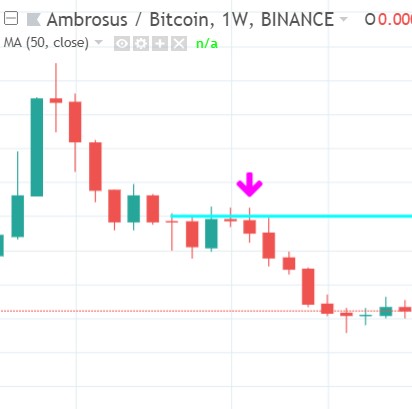
As you see, the higher timeframes acts as a filter to avoid bad trade decisions.
I don’t use the higher timeframes to look at the trend, because as we know trend is a lagging indicator, and on a higher timeframe chart it lags even more. This becomes obvious in the next example, a comparison of a daily chart (left) and a 3 hour chart (right):
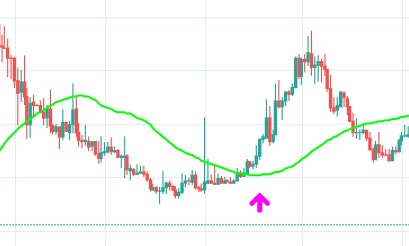
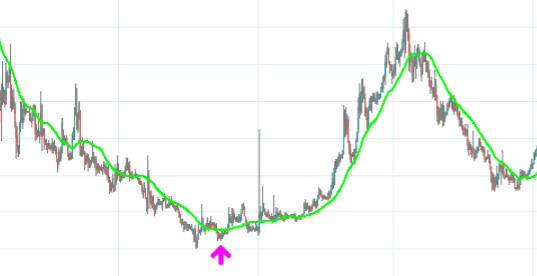
The arrows show the start of the uptrend as determined by an upsloping SMA50.
Besides that the faster signal also has its downside: it gives more false signals (too early):

Instead of using (lagging) trend, I prefer to use higher timeframes to confirm the momentum. Here is an example of an 1 hour chart:
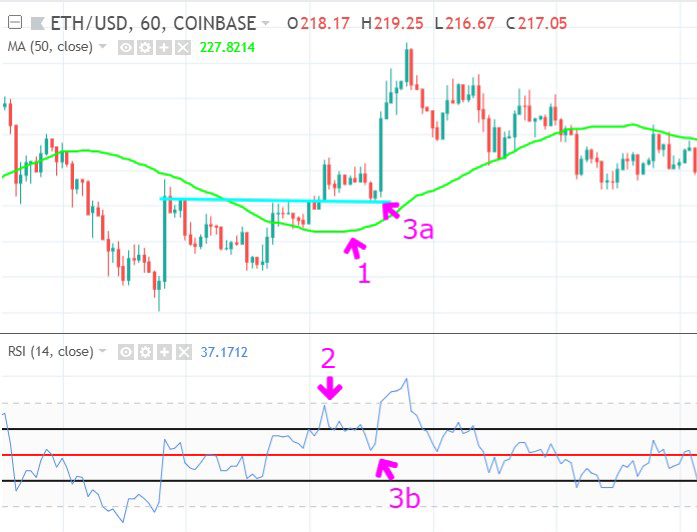
- Uptrend: SMA50 is sloping upwards
- Momentum is bullish: RSI upward and crosses 60
- a. Price runs into a support level (at blue line)
b. Momentum also runs into a support level: RSI 50 - Next I look at a higher timeframe chart for confirmation of the bullish momentum:
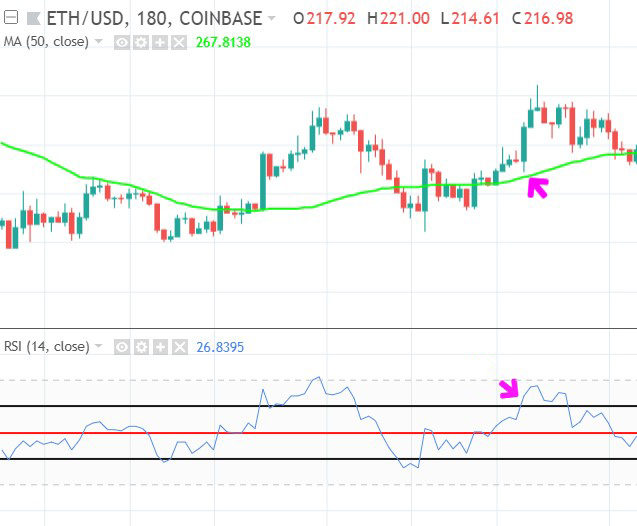
As you see, momentum is very bullish (RSI sloping up and above 60) so this is a good trade.
Also remember that we don’t want to trade late in a trend. So that’s why we want to buy the bottoms of the retraces of the first 3 waves in an uptrend, and after that the probability is lower:
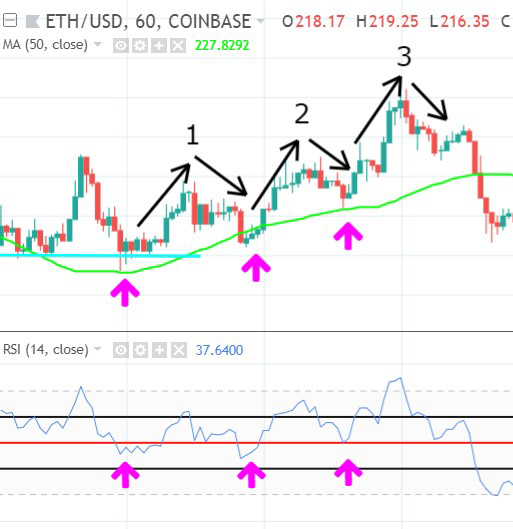
After the third wave in the uptrend, price retraces far below the SMA50. SMA50 turns sideways/ downward indicating the end of the uptrend.
But these were 3 nice opportunities, everything lined up:
- SMA50
- Support levels
- RSI
- Higher timeframe RSI above 50/60 confirming bullish momentum →
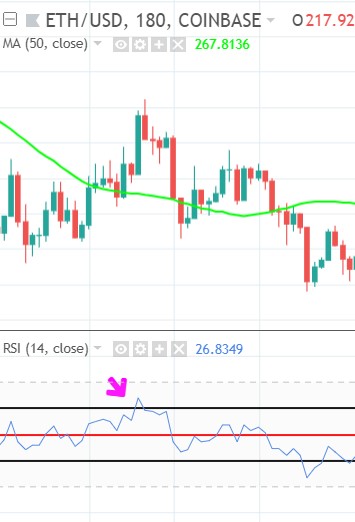
As you see in the higher timeframe the SMA50 is still indicating a downtrend, but as said the SMA50 is a lagging indicator, and on a higher timeframe it lags even more. So I ignore higher TF trend often and just look at the higher timeframe momentum to confirm my trade.
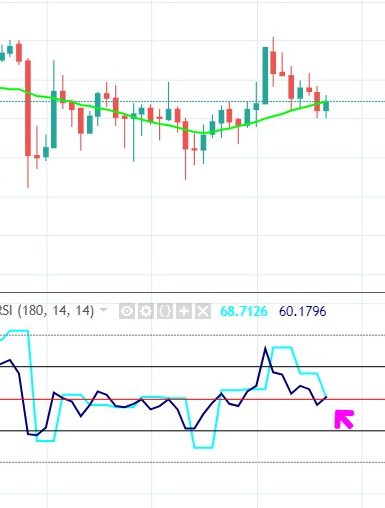
Here I have an example, where I want to buy at the bottom of the first retrace in a new uptrend. I have set RSI (dark blue line) and the higher timeframe RSI (light blue line) in the same indicator, so I can better illustrate their relationship →
As you see RSI (dark blue line) is still bullish, it respects 40 as support and even stays above 50 which is bullish territory. As you can see it just reversed upward. The higher timeframe RSI (light blue line), which lags a bit more, is still downward. To get the higher timeframe confirmation, I wait for this line to reverse upward also (and respect its 40 line also).
Mean-Reversion Trades and Higher Timeframes
My favorite “mean-reversion” trades depend heavily on the slope of the SMA50.
As MA’s are lagging, especially on higher timeframes, you would say that I avoid using higher timeframes for my “mean-reversion” trades…
But I do use higher timeframes to find my “mean-reversion” trades, all the time! How I do this? Please read next…
The “mean-reversion” effect happens on any timeframe. I actually trade them on all kind of timeframes, from 15m charts to daily charts.
How I use higher timeframes to confirm “mean-reversion” trades?
As I said in the previous chapter: When I look for this trade on a 1 hour chart with SMA50 on it, I also plot a SMA100 and SMA200 on it. Because the SMA100 and SMA200 on a 1 hour chart are equal to the SMA50 on a 2 and 4 hour chart respectively.
So when price closed below an upsloping SMA50 (on a 1h chart), and in the same move also closed below an upsloping SMA100 and/or SMA200, then the “mean-reversion” trade has a higher probability of returning to the mean → because when more timeframes confirm a signal → a larger group of traders see that signal → and a larger group will trade based on that signal → leading to a higher probability that the market will be moved by their trades (bigger self-fulfilling effect).
Example of a mean-reversion setup where price dropped below multiple upsloping SMA’s:
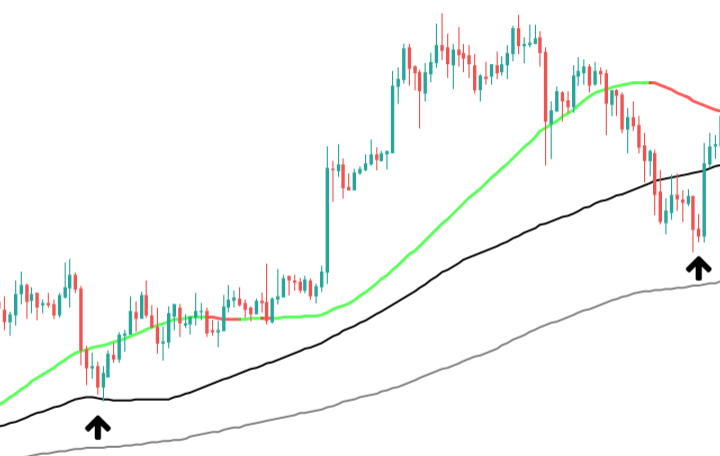
(green/red line = SMA50, black line = SMA100, grey line = SMA200)
In the above chart you see two examples:
- At the left arrow you see how price broke below an upsloping SMA50. Next it found support at the SMA100 and returned to the mean (SMA50). SMA100 and SMA200 were both below the SMA50 and both were practically sloping up.
- At the right arrow you see price broke below the upsloping SMA50 AND SMA100 and next returned to it. In this 2nd mean-reversion setup the SMA200 was also sloping up. BUT the SMA50 was already sloping down, this probably relates to price breaking down below the SMA100 in the first place.
The advantage of using these higher tf SMA50’s in mean-reversion trades:
While you have the upwards mean-reversion momentum (price being below the upsloping SMA50), at the same time the lower SMA’s are acting as strong “bullish” support levels. We know these lower SMA’s are bullish, because:
- SMA100 and/or SMA200 are sloping up
- SMA100 is above SMA200
- SMA50 is above SMA100
After price breaks below an upsloping SMA (support), it will often act as a resistance level, preventing price to go much higher above it. This implies that if price breaks multiple SMA’s, the upwards momentum decreases. It will probably still return to the last SMA it broke, but the chance of a return above that SMA is lower, as each SMA also acts as resistance level. This is very important to remember. That is why I prefer a setup like this:
Example of a mean-reversion setup consisting of multiple upsloping SMA’s, but price only broke the upper SMA50:
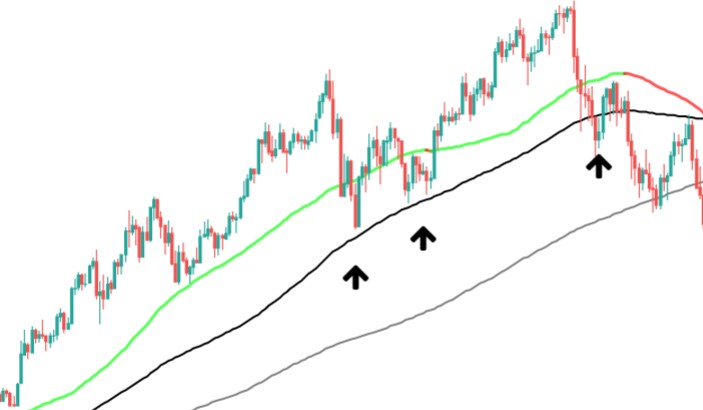
- At the first two arrows, price broke below the SMA50, and SMA100 held as support. These were perfect entries, for a mean-reversion trade, but also for trading a larger part of the trend.
- At the third arrow I added an example of what happens if price also drops below the SMA100, you see it has more trouble reaching the SMA50 again, and eventually the trend even ends. Of course this is an extreme example. Often when multiple upsloping SMA’s are broken in a single drop, price bounces back to respect them all. It is just important to remember that the probability of such a return to the highest SMA is lower, as each intermediate SMA also acts as resistance.
Nice detail: As you know I trade on an 1 hour chart most of the time. The SMA50 I plot on the 1 hour chart is actually equal to the SMA200 on the 15 minute chart, and that is a very important and strong support/ resistance level for traders on that chart.
But in the end the slope of the SMA is the most decisive condition. As is illustrated in this example:
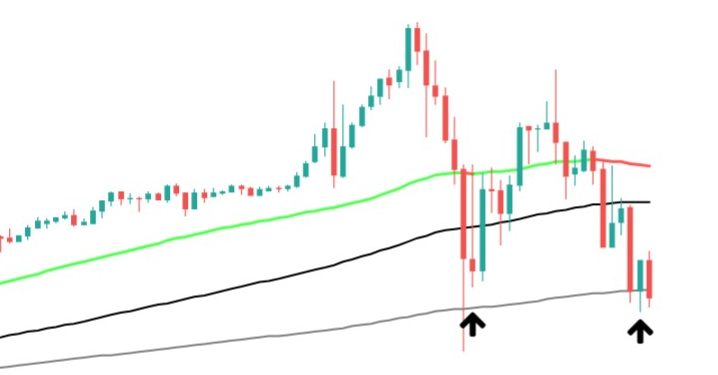
Both drops below the SMA50 are actualy equal, the only difference is the slope of the SMA50, and that turned out to be the decisive condition. At the first arrow price returns to the SMA50 and beyond, at the second arrow (where the SMA50 is already sloping down) price fails to reach the SMA50 again.
But this chapter was about higher timeframes, not about my favorite “mean-reversion” trades (I love to talk about it 🙂 ) At the end of the course I have a bonus chapter, exclusively about my mean-reversion trades!
LAST TIP: In my experience the following timeframes are the most important, as these are used by most traders:
- 15 minute
- 1 hour
- 2 hour (least used tf in this list)
- 4 hour
- daily
To summarize this chapter:
- On a higher timeframe chart I want to see strength confirmed. I look at momentum on a higher timeframe chart because it is a leading indicator (as trend lags too much).
- Higher timeframe RSI has to break above 60, respect 40 as support and preferably be sloping upwards.
- Higher timeframes also play a big role in mean-reversion trades.
You have now set your fifth step towards a high probability trade. Still 2 steps left to take before we can make a balanced trading decision. Remember: Never skip a step, or you might fall.
Keep it simple!
Click on the next button to go to the chapter 5: Timing your Trade