Chapter 5 Timing your Trade

Most traders emphasize on price when making a trading decision. But in my opinion timing is just as important. I guess timing is actually the most important step in my trading system. Trading is about buying or selling for the right price at the right time, isn’t it? Often the best opportunities last very short. 

But what is the right time? How can you possibly know?

As I have explained in chapter 1: a trend consists of multiple waves. I count the waves, or “cycles”. As said earlier I found out that after the third cycle it is more dangerous to enter. Now each of the waves consist of move up and a move down. In an uptrend we call these up-moves the “impulse” waves, as shown in this image:

wave_up_count_crypto

And the down-moves are known by a couple of names: 

  • correction waves
  • retracements
  • retraces
  • pullbacks

And look like this:

wave_down_count_crypto

When I look for the best timing of my entries: I actually want to buy at the bottom of these retraces:

retracements_mean_reversion
  • So I trade these waves as early as possible, within the first 3 up waves
  • And I want to trade it in the direction of the uptrend
  • So I enter at the end of a retracement / the start of a new impulse wave.

After 3 up-waves the probability decreases and the trade can more easily turn against you. Often a drop below the SMA50 will be in the form of a complex ABC retrace by then. Based on Elliott Waves Theory I use the following template as a reminder of how the idealized trend looks:

elliott_wave_crypto

So the trend often consists of 3 up-waves, after those the probability for trend continuation is lower and retraces will be more often complex abc retraces that initiate a the end of the trend and possibly a trend reversal.

The best trade is to buy the first retrace in an uptrend. This comes down to timing, you have to know how to time these bottoms. In chapter 2 you learned that momentum can tell you how much the price will probably move.
In this chapter you will learn about two indicators that can tell you WHEN the market makes its move:

  • Stochastic indicator
  • MACD indicator

I have customized and optimized both these indicators.

Stochastic indicator

The Stochastic indicator was originally developed as a Momentum indicator. I have changed the settings to give this oscillator a higher frequency, so I can use it as a timing tool. 

I use the following settings in Tradingview: K = 5, D = 3 and smooth = 2:

The stochastic oscillator consists of 2 lines, de k-line is the actual stochastic and the d-line is a 3 period MA of the stochastic, obviously the d-line is a little bit smoother and lagging. On the oscillator you also see 2 horizontal lines, at 20 and 80: 

  • stochastic above 80 is considered to be an “overbought” signal
  • stochastic below 20 is considered to be an “oversold” signal

By adjusting the oscillator with the above settings, it turns into a timing indicator. It is now optimized to dispay short term oscillations in the market. It will help you find the wave highs and wave lows. As said earlier, we need the exact timing of these wave lows, or the bottoms of the retraces, because those are our entries.
You want the Stochastic indicator to tell you:
when the retrace done and a new impulse wave is about to begin.
In the next example you see the stochastic is about to cross above the 20-level:

But often you have the risk of a double bottom, when the Stochastic makes another low, like this:

This is why in this step I wait for the Stochastic to cross up the 20 line (lower dashed line), back into more bullish territory. Even then it could still go down and make another bottom, but now those chances have diminished considerably. Often when it makes still another bottom, the other steps are telling us not to trade:

Here you see that after the Stochastic initially crossed up the 20 line, it made another drop below it, and price dropped hard. 

How to avoid this? The other trading steps prevent you from taking such a low probability trade: 

  • SMA50 (green line) is sloping down (we only buy in an uptrend)
  • RSI is showing weakness, because it’s angled down and failed to return above 50 (bullish territory)

Next lets have a look at my second timing indicator: the MACD.

MACD indicator

The MACD is made of the difference between two MA’s, so it shows us the convergence and divergence between them, hence its name MACD: 

Moving Average Convergence Divergence

It shows us the recent price action in relation to earlier price action.

I use the default MACD settings:

I tweak this indicator by adding a Bollinger Bands (BB) indicator to it. Again I use the default settings:

BB consist of three lines, the upper, middle and lower bands. The middle line is a 20 period MA. The upper and lower lines represent 2 standard deviations from that MA each. So it is a 4 standard deviations wide MA channel. 

  • But you can forget about all that. What matters is the statistics: 
  • the probability that price is within those 2 outer lines is 95%
  • But what is more important: the chance of price being either above the upper band or below the lower band is 2,5%. 

For example, if price is below the lower band, then the probability that it will go above the lower band is 97,5%, so it’s unlikely price will remain below it very long. Now instead of price I will add this BB to the MACD, it looks like this:

The MACD is the thick black line. Just as MA’s are lagging, so is the MACD. I use this as a confirmation to the Stochastic timing tool, but keep in mind it is a bit late usually. This is how I use it:

When the Stochastic is crossing up the 20 line, but I still doubt for whatever reason, then I look for extra confirmation on the MACD/BB:

I want to see the MACD line reverse upwards. But the best is a bounce up off the lower Bollinger Band or crossing up the lower Bollinger Band.

But neither step of our strategy can stand on its own, you need the confluence between all of them to know if a trade has a high enough probability. All the necessary signals need to confirm eachother. A contradiction between the different steps is actual a signal to be careful.

For example, here you see that both your timing indicators, Stochastic and MACD/BB are giving an entry signal, but because we are in a downtrend (SMA50 is sloping down), this isn’t a good trade. The chart confirms this, because there isn’t a subsequent impulse move, price even drops further down:

Here another example:

Btw. You can also use these timing indicators to time your exit. Here I used my timing tools to exit trades:

But when exiting trades you should also use momentum and all the other steps to know your odds.

So timing is of the essence, but we still need to take all the 7 necessary steps, look at it from 7 independent perspectives, and strategically combine them, to know if it really is a good trade.

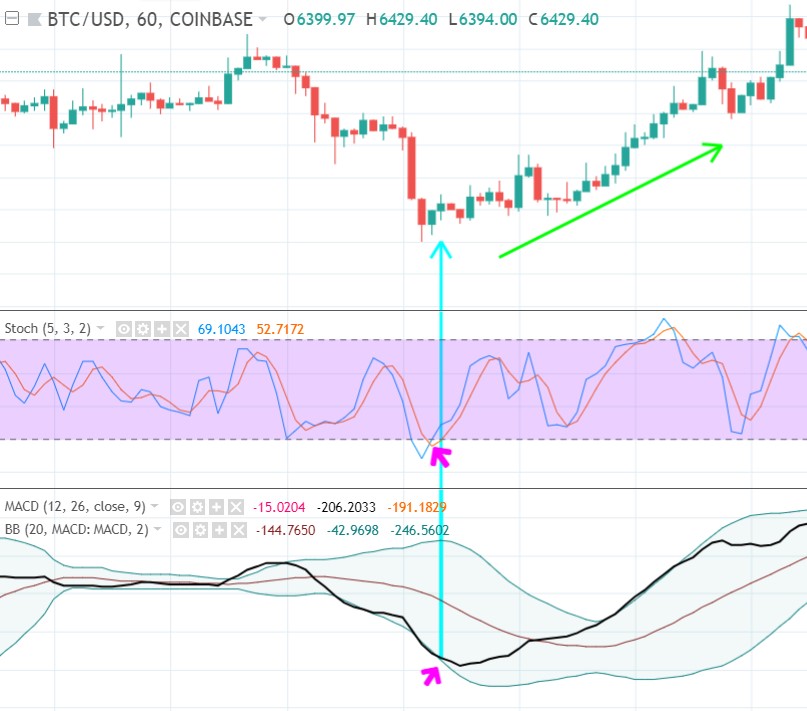
To summarize the previous step:

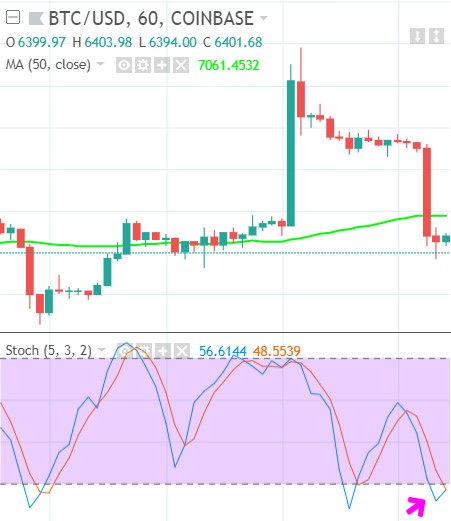
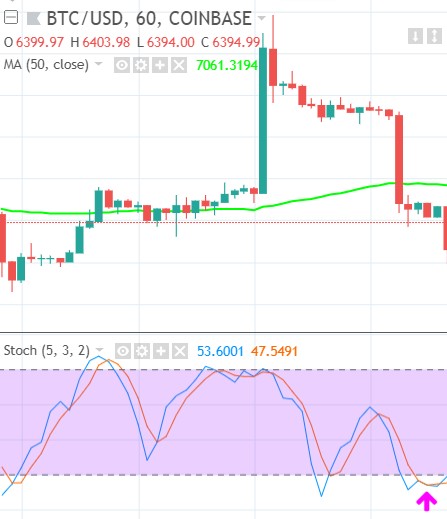
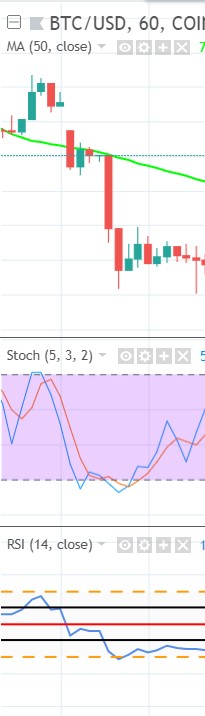
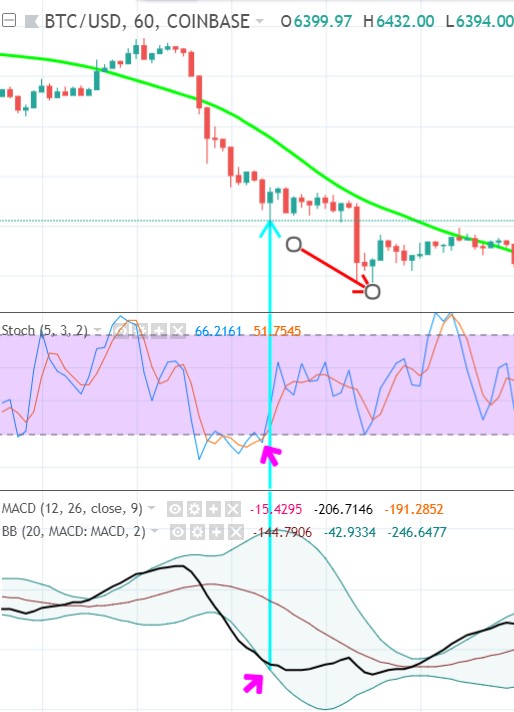
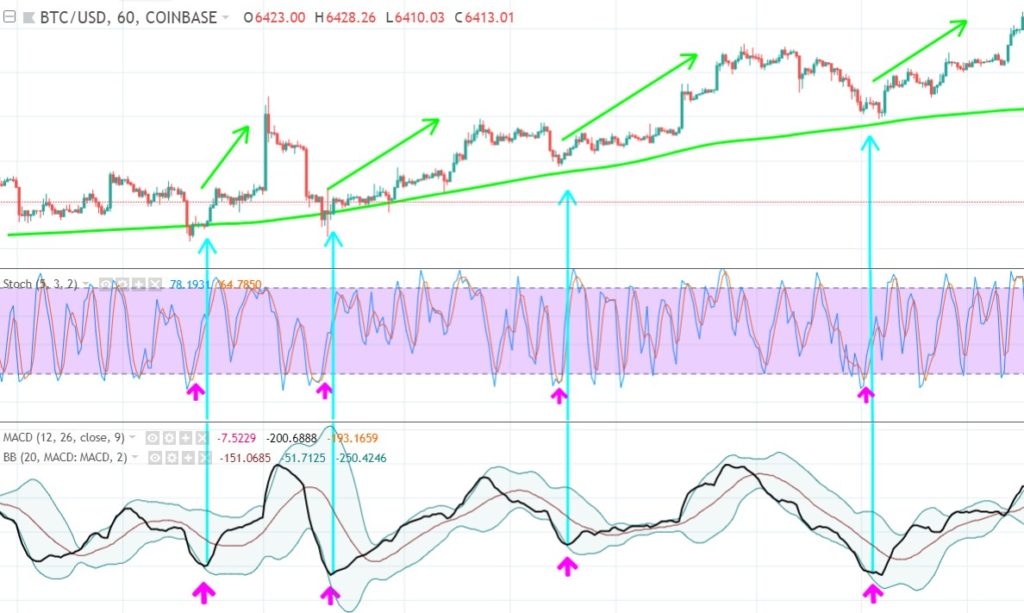
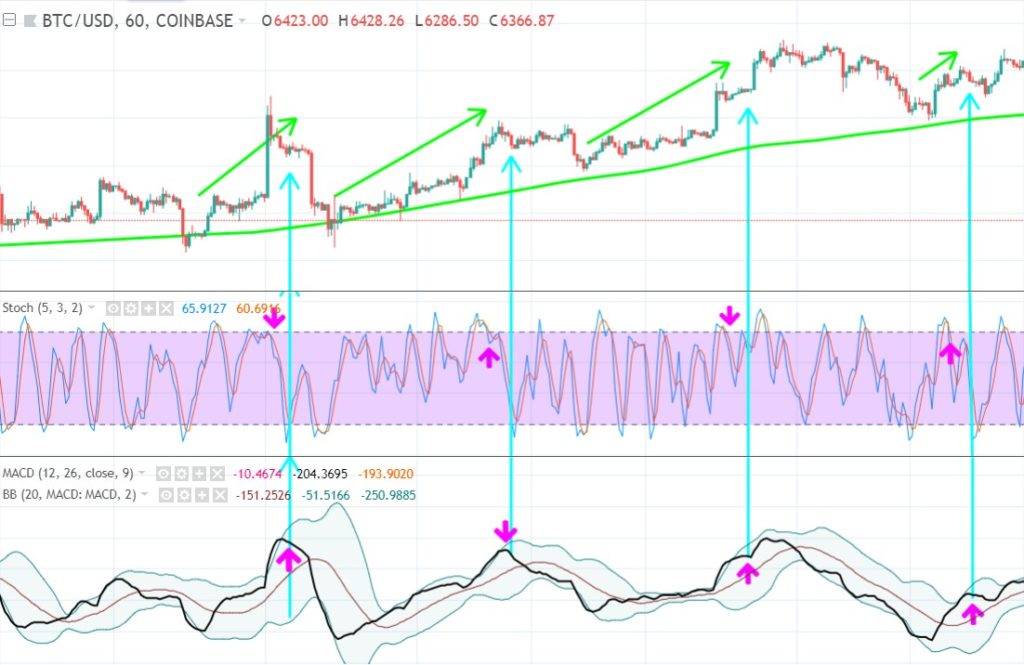
  • I time the entry using the custom Stochastic reversing upwards, preferably crossing up 20 (when shorting it should reverse downwards, preferably crossing down 80)
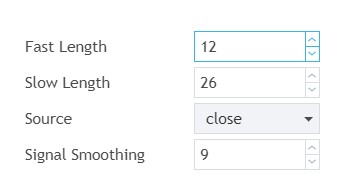
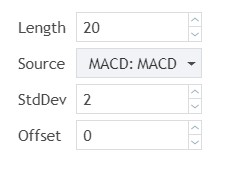
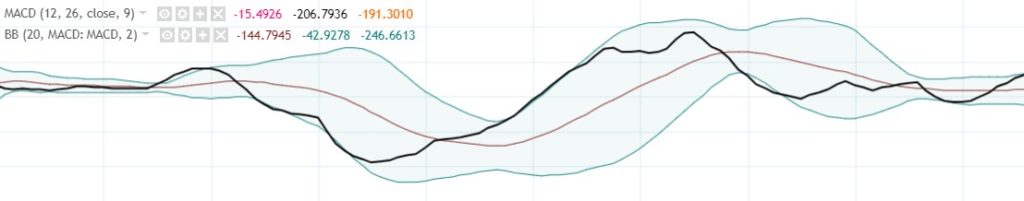
  • I often confirm my timing by the MACD line bouncing up off the lower BB or the MACD line crossing up the lower BB band (when shorting it should bounce off down the upper BB, or cross down the upper BB)

So you now finished the 3rd step. Still 4 steps left to take before we can make a balanced trading decision. Remember: Never skip a step, or you might fall.

Keep it simple!

Click on the next button to go to the chapter 6: Orderbook and Depth chart