Chapter 6.3: Sentiment Analysis

I added this lesson about trading sentiment in this chapter, because right now you are familiar with the trdr tool, and might be interested in what more can be done with it.

So next to orderbook analysis, the trdr tool is actually also very helpful in sentiment analysis. For the following examples I use the trdr Open Interest and Long/Short ratios. If you don’t have trdr, then you could also take a look at the open interest and long/short data pulished by Binance:

https://www.binance.com/en/futures/funding-history/4

Open Interest and long/ short ratio

(Futures) traders are always searching for information to get an edge in the market. The most valuable information is one that provides insights into what other futures traders are doing – Open Interest offers this information if you know how to interpret it. By understanding open interest and its impact on crypto prices, it can help you make better-informed trading decisions.
Open interest and volume are related concepts. Volume accounts for all contracts that have been traded in a given period. On the other hand, open interest considers the total number of open positions held by market participants at any given time. Regardless of position, open interest is calculated by adding up all opened trades (long and short) and subtracting away trades that have been closed. 

The long-short ratio shows the proportion of futures traders with long positions versus the proportion of futures traders that are in short positions.

This is all about retail trading sentiment, which can be gauged by looking at long/short ratio,
liquidations, and open interest.

Please take a look at the following example. As price went lower, the long/short ratio and open interest both went up, conclusion: new long contracts were opened:

Next price made a fake out, open interest went down, as many longs got liquidated:

But some longs would still be alive, what do many of them do when price comes near their
entry level (after such a bearish breakdown)?
They close their long positions break-even by selling it: sell pressure/ resistance:

Next price manages to break above this resistance/consolidation.
What do we expect, a weak or a strong move?

When we were at this level before the fake-out, there weren’t many contracts
added/subtraced, open interest remained flat. This usually means there aren’t many
contract opened at that level. So there probably will be few contracts closed at that level
now, so I expect little resistance.

And price cut right through this level. Makes sense?
So we need to know why price behaves in a particular way near s/r levels. 
At this previous resistance, long/short ratio increased while open interest went up. So the number of longs increased there. Next price makes a dump, some will get liquidated. But what
happens to those longs still alive? many will try to exit asap when they’re break even. Their
sells create resistance at this price level:

But the most important take-away is:

When open interest remained flat at a previous high/low –> there weren’t many contracts opened at that level –> so in the near future there aren’t going to be many contracts closed at that level –> so that level will likely give little resistance/support –> so price is likely to break that level.

So that is how open interest can help you determine how strong a s/r is going to be in the near future.

Another example:

Price dips, long ratio increased + open interest increased = long contracts opened. Next
price drops violently below the break even level, and price bounces back up, but doesn’t
manage to get higher that the low of the initial dip, why? Because those longs that survived
the violent drop now exited break even, this sell pressure created that local resistance and
prevented the bounce from getting higher.

Next (zoomed in) many went long into the violent dip but too soon:

Now you see where they got out break even and created a local resistance.
And an example when open interest doesn’t change much:

Not much longs entered at that level, so we know that few longs will exit at that level, so
probably little resistance, and voila: price went straight through it!

That’s it for now, hope it makes sense. And now let’s look at our near future right now.
What happened here:

July 6th price made a nice move upwards.

Short ratio increased + open interest increased = new shorts opened.

So many traders think this is the top, and shorted it. But what happens if price is going higher? Some of them will get liquidated. And those that survive? They probably exit break-even when price comes back to this level. So that makes this price zone
a support zone:

Keep that in mind when price breaks to the upside, almost none of those shorts got liquidated yet:

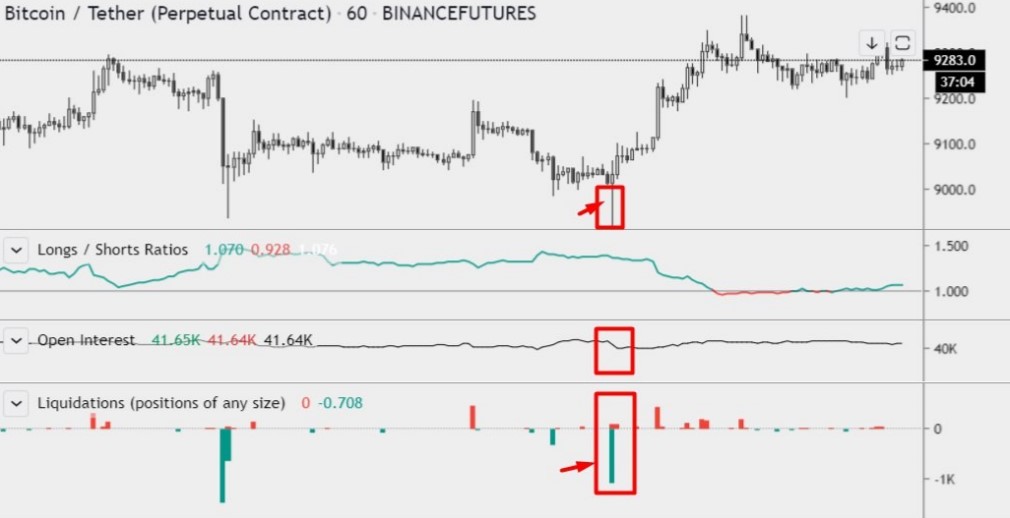
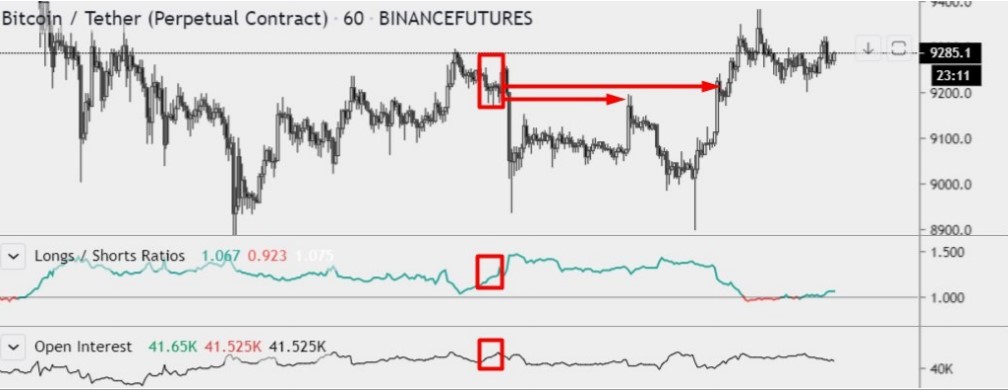
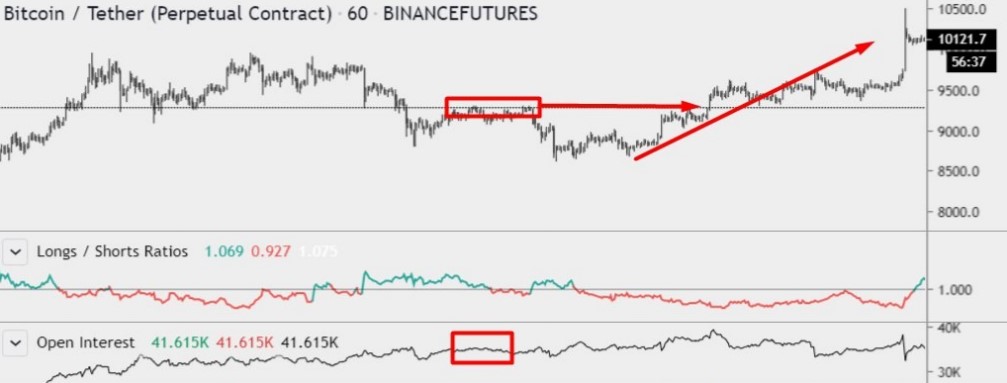
So they’re probably all still waiting for the drop. So most of them will still be in their short
position when price goes up instead, and their break-even buy-backs will support this level
when price retraces down to it –> bullish sentiment.

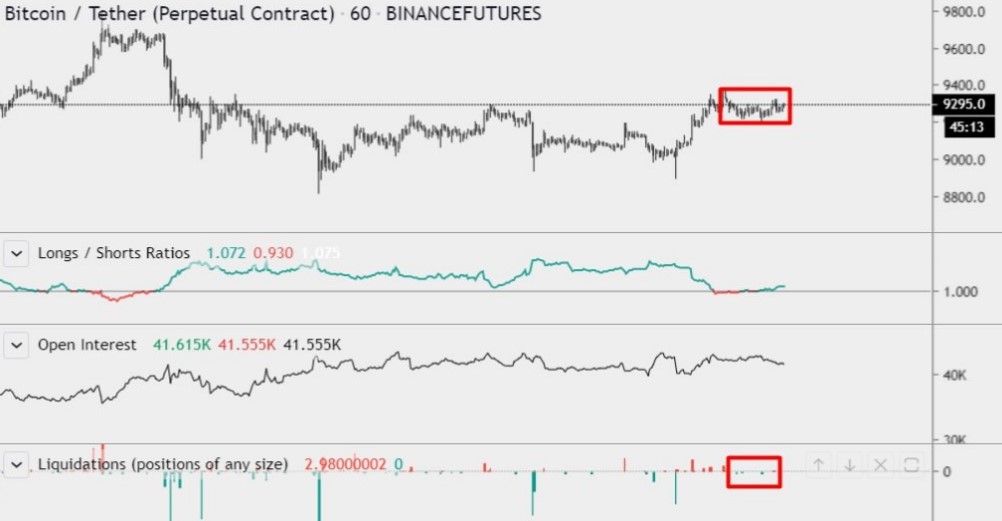
Btw. all the indicators I used are from trdr. Feel free to use my referral link, I’m not affiliated to trdr, I just like to use their tool.

This is the end of the sentiment analysis chapter.

You have now set your sixth step towards a high probability trade. Still 1 step left to take before we can make a balanced trading decision. Remember: Never skip a step, or you might fall.

Keep it simple!

Click on the next button to go to the chapter 7: Market Correlation