This chapter is supplementary and shows you what else can be done with this knowledge.
Now that you have come this far I really like to push the limits of what this course was meant to be about. By now you have a good idea about high probability entries.
In this chapter I will focus on trend trading. Many other traders will tell you the same: “the trend is your friend” and “always trade with the trend”. But the earlier we get into a new trend, the longer we can potentially be in it. This is what trendtrading is all about.
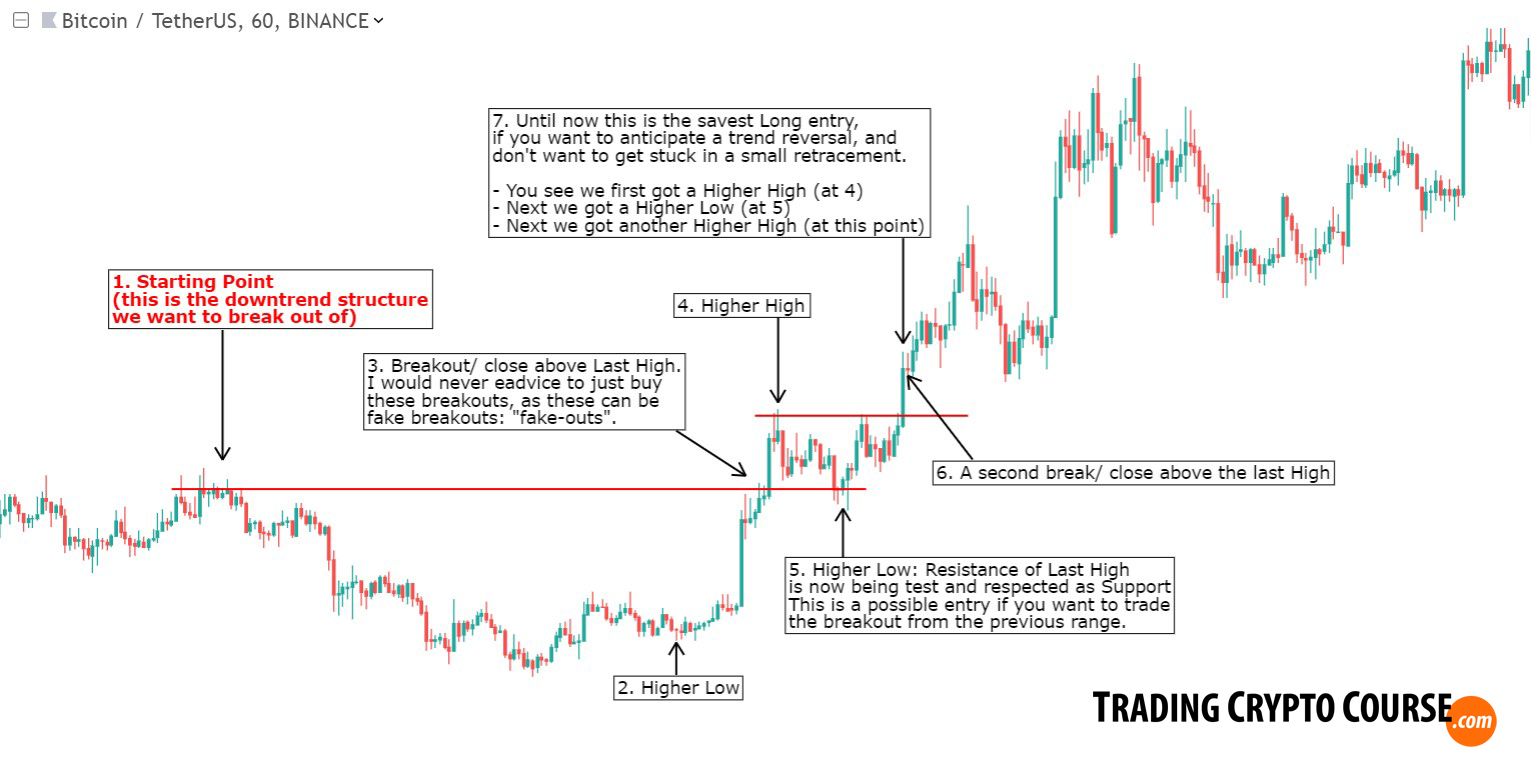
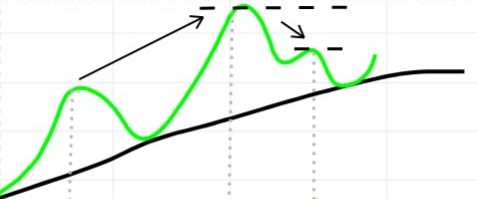
Many traders define an uptrend as higher highs and higher lows. Here I show you the schematic chart example from chapter 3 one more time. This is the essence of what trading trend reversals through chart patterns is all about.

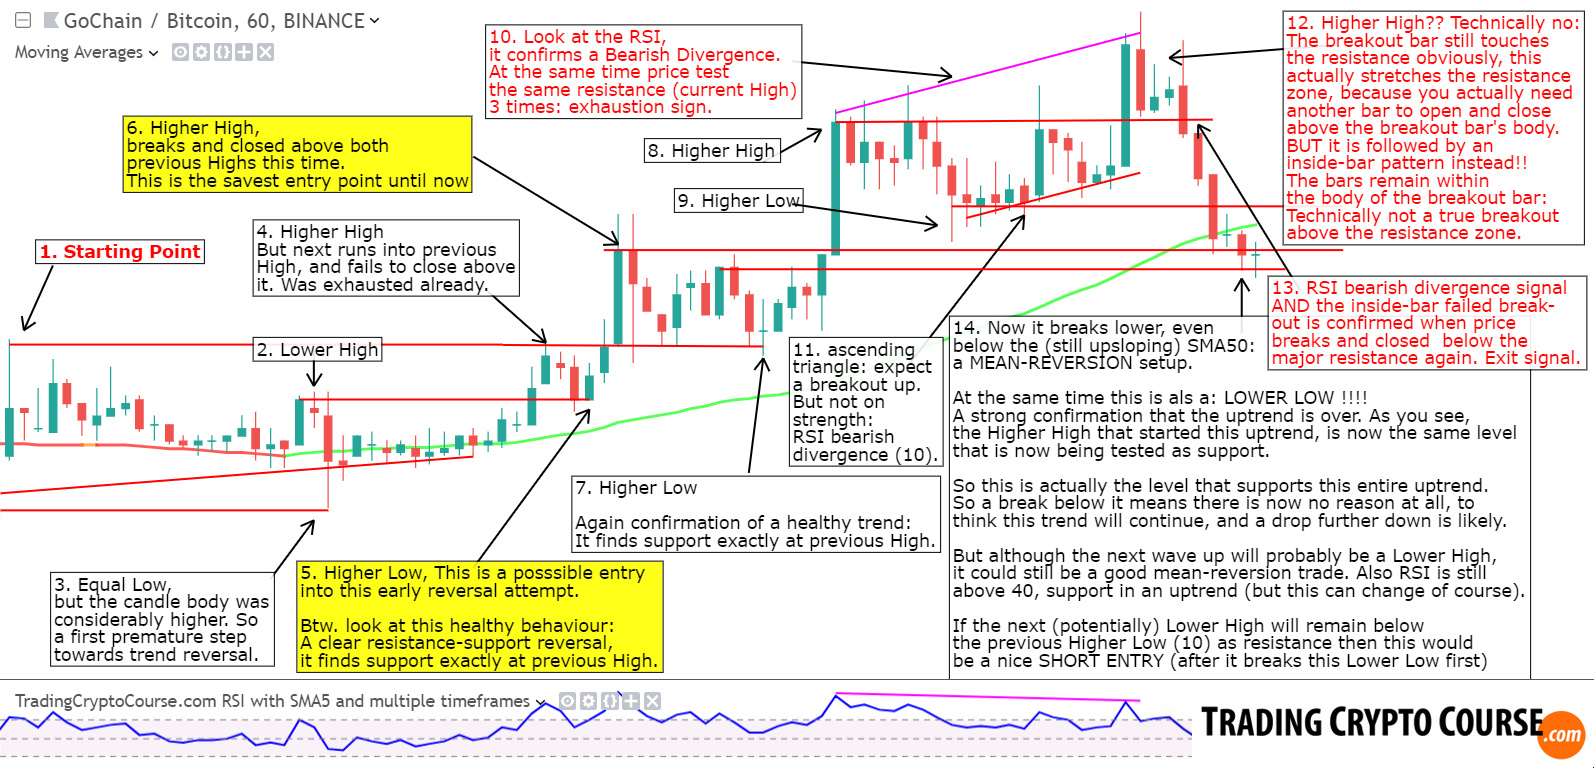
And next some real-world examples (also from chapter 3):
Next an example where trend trading and mean-reversion trading come together in 1 chart. The trend ends in a low probability mean-reversion setup (too late in the trend – after the trend already made a lower low – like I mentioned at the end of the previous chapter):
Unfortunately charts won’t always follow such a structured path. Crypto markets are often very manipulated, so in crypto breakouts often happen without a clear pattern prior to it. That is why I also use other tools to confirm an early trend. Chart structures is actually just 1 step in my 7-step method. Other tools to determine the trend are moving averages. Preferably the SMA50.
And besides trend, you need more to confirm a good entry opportunity: You need a STRONG trend.
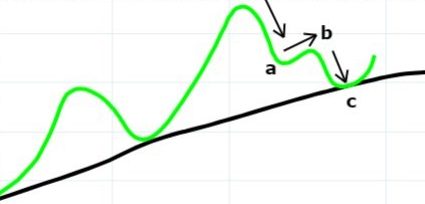
When trendtrading you have to deal with the same issue as in the previous chapters. When buying the bottoms of retraces in an uptrend, or buying the mean-reversion setups, you often have to deal with retracements that seem to have reached the bottom, but then don’t make a higher high, but continue to drop even lower, I like to call these a “double bottom”. But officially it is called a “complex ABC retrace”, and looks like this:
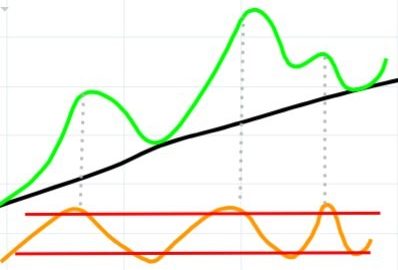
The problem with these complex retraces is that this is the picture that the Stochastic often paints at the same time:
It makes it look like another wave up, when in fact we are still in the middle of the previous downwave, but in a complex form. You could know that it is an abc retrace though, because it isn’t making a higher high:
This can mean 2 things:
- lower high, signalling the end of the uptrend
- not actually a lower high, but a complex retrace (and trend continues)
Price doesn’t tell us what it is, you need momentum for that. So MACD, RSI or volume. And as you can see, the EMA15 also plays a role in these complex retraces.
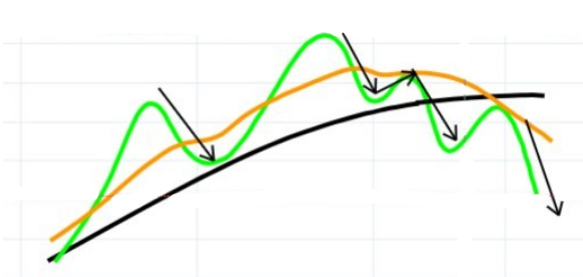
(EMA15 is orange line SMA50 is black line PRICE is green line)
The more space between the EMA15 and SMA50, the stronger the trend is. This made me realise that the EMA15 could help me to get in early in a new trend. It also made me realise that catching a whole uptrend is better than only catching individual waves.
So in this chapter I will focus on how to catch uptrends. I will add volume to my system by integrating the MFI indicator (money flow), that’s RSI but then weighted by volume. Next I also started looking at divergence patterns, as extra confirmation when the trend has lost momentum and it’s time to get out.
There are 2 kind of trend trend traders:
- Aggresive trend traders prefer to buy once price breaks out (above the SMA50).
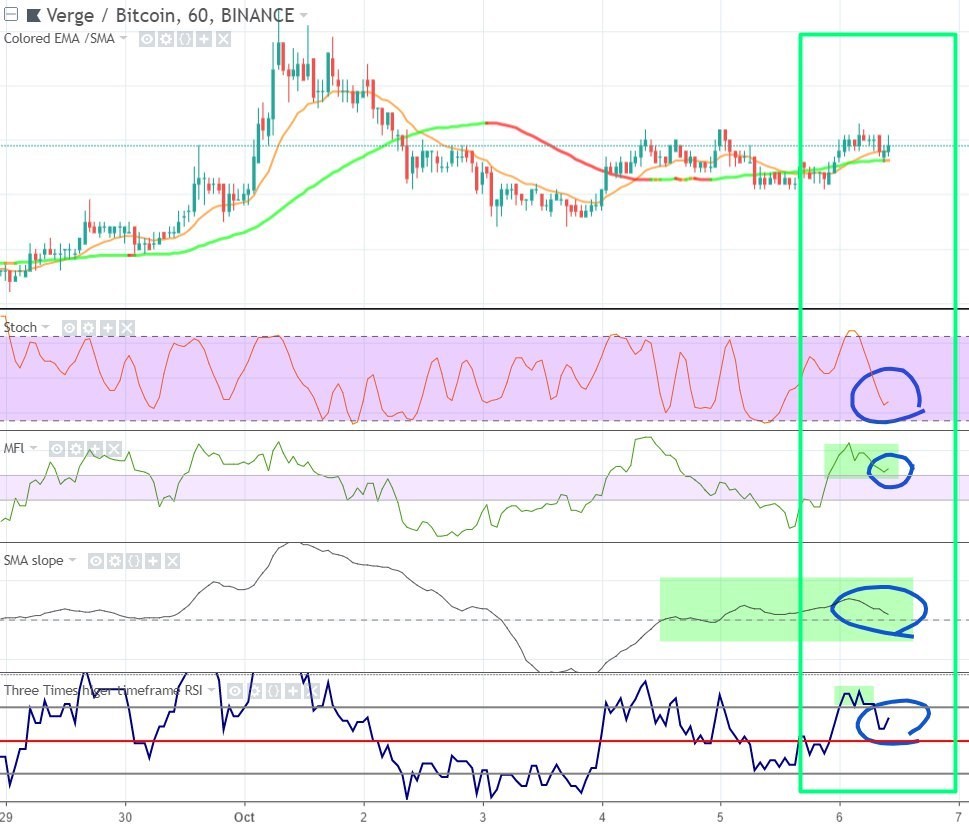
- Conservative trend traders wait for an early confirmation the trend is going to hold, so they buy the low of the first retracement in an uptrend. This is also what I prefer, I try to buy the bottom of the first pullback in an uptrend. I look at it like this:
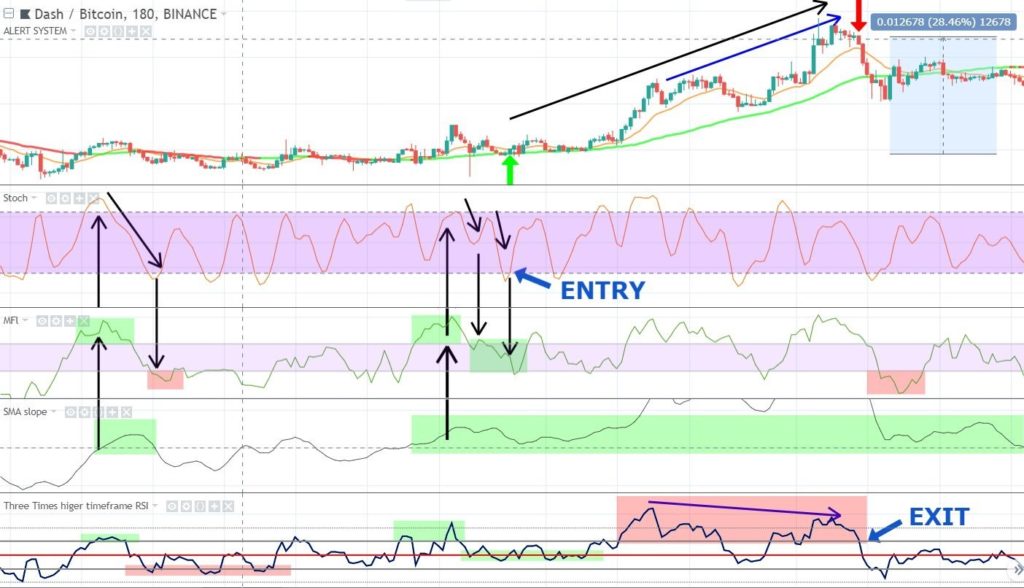
(The 2 horizontal MFI lines are 40 and 60: just like in my RSI)
(For explanatory purposes) I have added a “SMA slope” indicator to the above image, that shows if the SMA50 is sloping up or down, when it is respectively above or below the dashed zero-line.
As you can see in the example,
- I start looking when SMA50 is sloping up.
- Next I look at the MFI, it should be bullish, above 60.
- Finally I look at the Stochastic to confirm the first low: by crossing above the 20 line.
After I entered I start to look for exit signals. I look at MFI and RSI for bearish divergence, indicating the trend has lost strength. Momentum is a leading indicator and when it diverges from price action, it is often a good indication price will do the same.

As illustrated in this example, this is what a bearish divergence looks like.
- While price makes a higher high
- momentum makes a lower high
indicating that the last high wasn’t made on strength. It often indicates price will also make a lower high soon. And in trendtrading this signal helps us find the top of the trend, and get out just in time.
As illustrated in this example, this is what a bearish divergence looks like.
- price makes a higher high
- momentum makes a lower high
Indicating that the last high wasn’t made on strength. It often indicates price will also make a lower high soon. And in trendtrading this signal helps us find the top of the trend, and get out just in time. I have actually written an entire lesson about divergences.
Recap:
ENTRY:
- Look for specific chart strucuteres. Preferably a higher low, followed by a higher high, and preferable enter after price breaks above that higher high.
- SMA50 has to start sloping up and EMA15 needs to move up and away from the SMA50.
- First I want to see RSI or MFI break above 60 in an early wave up.
- Then RSI or MFI has to stay above 40 at the bottom of subsequent low (I prefer around 50 or 60 actually for stronger momentum)
EXIT:
- I wait for MFI to drop below 40 or
- RSI or MFI to show bearish divergence (whatever comes first)
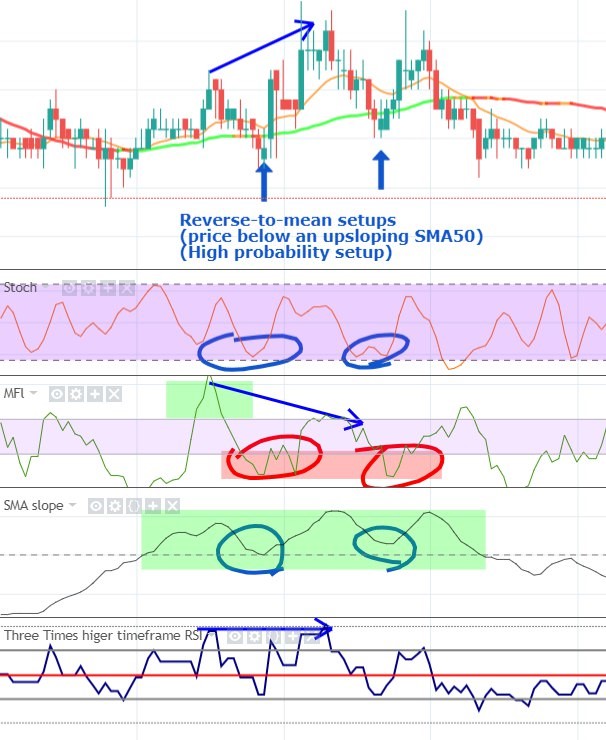
As you can see in the next example below, the following entries are not really strong, as MFI went below 40, and next MFI already signalled bearish divergence. The uptrend ended very soon afterwards. Even though they didn’t had enough momentum for a big uptrend, these 2 entries are excellent mean-reversion setups:
BUT In hindsight everything looks easy and obvious, but you need to have the ability to know how these trends look and behave BEFORE they have formed, without knowing the end result, so without the hindsight bias.
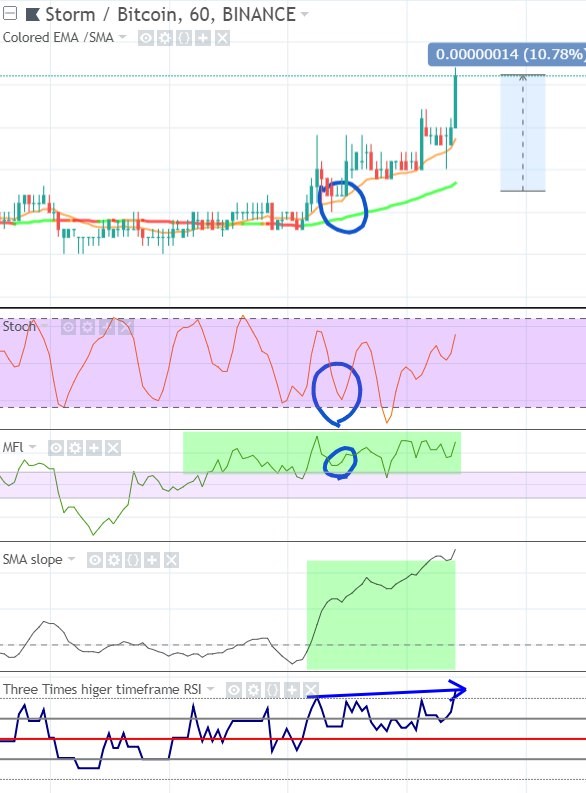
Just want you to remember the next STORM chart, because it is a textbook example of why and when you should enter a trend.
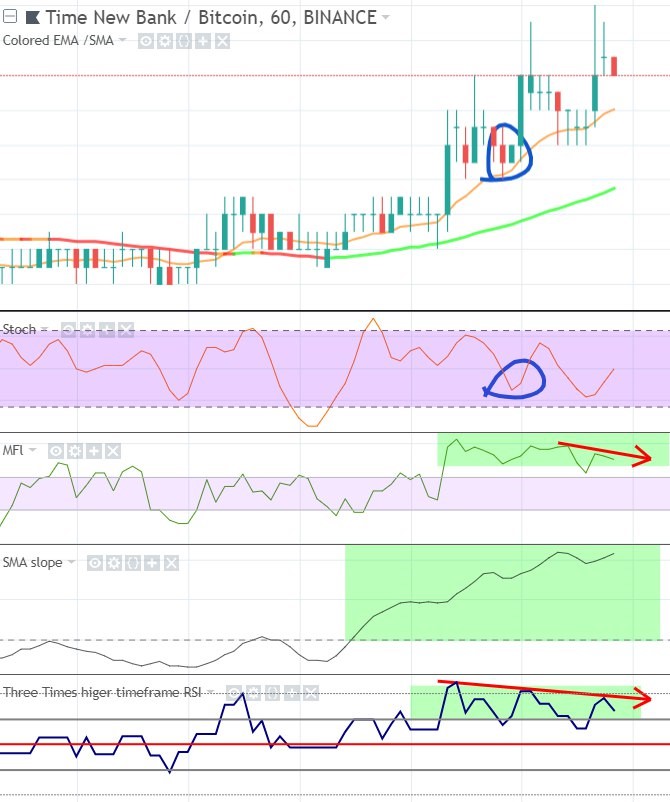
TNB was a nice textbook example of a divergence that signals weakening of momentum, and thus the possible end of the trend. An exit signal without the hindsight bias:
- Still the most important condition is that the SMA50 slopes up (if going long)
- Next you look if MFI and RSI reached above 60 already.
- Next you look at the Stoch for the bottom of the first retrace.
- When at the bottom, RSI and MFI shouldn’t be below 50, but also preferably around 60 (for real strong uptrends) and SMA50 should still be above 0. The less you see the SMA50 lose its upwards momentum during this retrace the better (the stronger the trend).
Another good example, shows why you need MFI (volume) to confirm the strength of the trade:
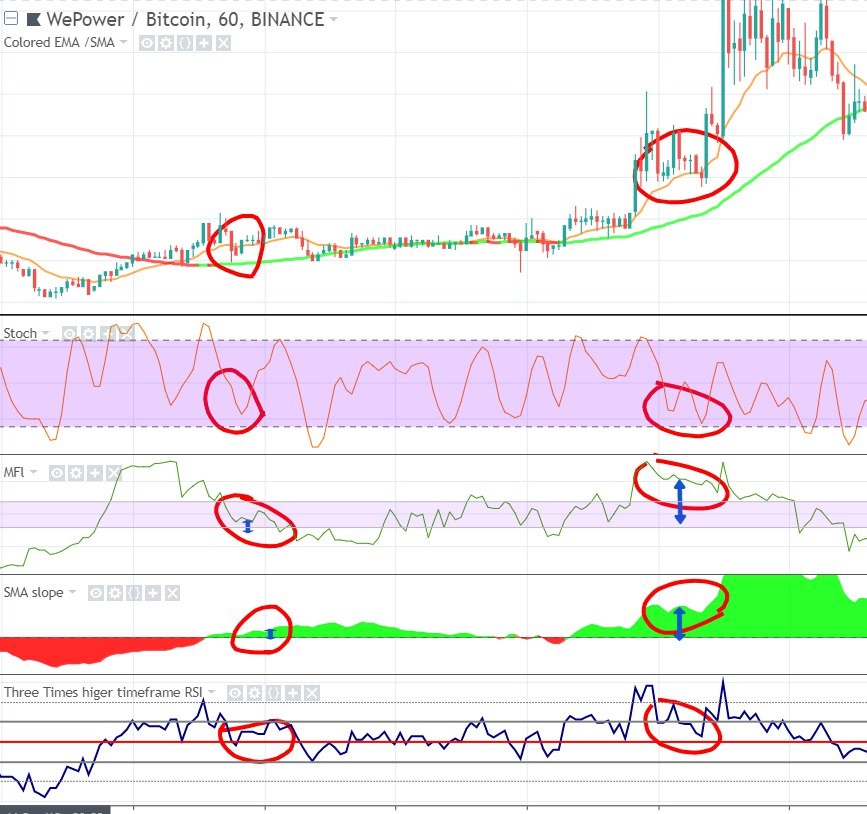
(While RSI doesn’t show much difference between these very different setups)
So all I am showing in the above examples is:
TREND, STRENGTH (momentum) and TIMING.
This is my focus for finding entries in early uptrends. But of course I also need to look at CHART STRUCTURES, HIGHER TIMEFRAMES, BITCOIN and total market cap behaviour, and right before I enter one last look at the DEPTH chart, just to make sure nothing is in my way.
It is always best when you can buy using clear chart structures, with support in the back. Also because it gives a perfect position below it to place your stoploss (but never too tight because of stop-hunts, remember ).
Congratulations my dear student 🙂 !!
Be proud you have made it this far!
This was the last chapter and last invaluable piece of information
I wanted to share with you in this course.
I really hope you enjoyed this course and sincerely hope
it will be proof to be a solid base to your trading activities.
Remember a trading method and trading in general
will grow on you by practice and perseverance.
Click below to go to my final word,
make sure not to skip this last part,
as it contains information about how to contact me,
our community and the tools that come with this course.