Downloads: Premium Indicators

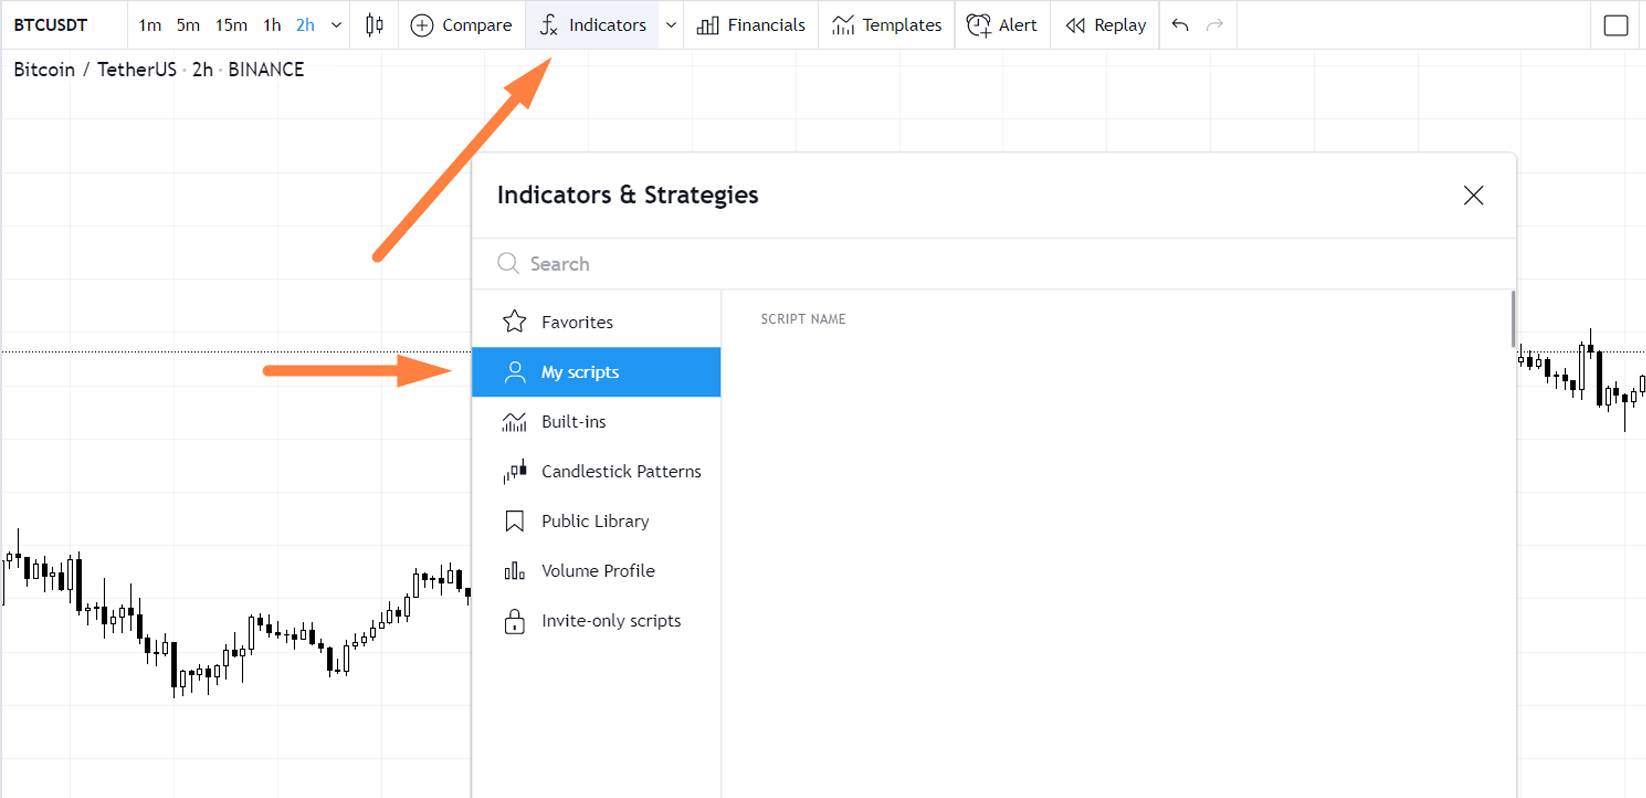
In my method I prefer to use a couple of powerful custom Tradingview indicators, that I have built myself. These are free for my students. Very powerful tools, if used correctly. Please feel free to check them out, and add them to your trading toolkit. 

As a student of this course I give you the source code of my indicators. At the bottom of this page I explain how you can add these indicators to your account. Please click here.

Multi Timeframe MACD extreme momentum indicator (BETA)

  • This is a brand new indicator that I’m still working on. It’s not yet covered in the course. Some of you might have read my studies on the Telegram group: https://t.me/coincarltalks.
    So far it seems to be a very valuable tool. But also very very complex. You really need to learn to read the patterns.
    It’s based on my MACD-Bollinger Bands indicator, you’ll come across lower on this page.  But the big difference is that this indicator looks at 6 different timeframes. And for each timeframe, it plots red when the MACD is above its upper Bollinger Band, and green when it’s below its lower Bollinger Band. This is a bit counter intuitive, but red/green stands for overbought/oversold. But as you know by now, overbought/oversold are dangerous terminology. The market can continue down much further, after an indicator signals oversold.
    That’s why you need to learn how to read this indicator. Green on the higher timeframes indicates a strong downtrend, while green on the lower timeframes, combined with red on the higher timeframes indicates the end of a pullback in an overall strong uptrend. 
    As you will find out, this indicator visualizes how timeframes interact.
    -Early trends: Trends always start on the lower timeframes (everything does), but for a trend to mature depends on the higher timeframes picking up this lower timeframe momentum. 
    -Trend exhaustion: You’ll see that trends exhaust, fail to continue, when the higher timeframes start to fail to pick up the lower timeframe momentum.
    For example: the 4 hour timeframe momentum is key. When the daily fails to pick up the 4 hour momentum before it vanishes, is a strong trend exhaustion signal:

When all timeframes show the same extreme momentum at the same time, this is a characteristic of a swing high/low.
Conclusion: this indicator gives an unique visualization of the relationship between extreme momentum on multiple timeframes.

  • Mean Reversion indicator
    In the course you have learned how to trade mean-reversions, in bonus chapter 1.
    As you already know, these are my favorite trades. I get a very high win-rate on these.
    But these are not entry signals, you really need to learn how to trade only the best entries.
    -black triangle: potential mean reversion to the SMA50
    -green triangle: potential mean reversion to the SMA100
    -red triangle: potential mean reversion to the SMA200
    -black line: SMA50
    -green line: SMA100
    -red line: SMA200 
  • Timing indicator
    The most powerful indicator in my method. 
    This is a custom fast cycle indicator, that I use to time my trades.
    Remember you can set the timeframe of this indicator independent of the price chart.
  • Trend indicator
    50 period SMA (color coded) and 15 period EMA merged into one single indicator.
    The color of the 50 period SMA indicates if the slope is up- or downward. I also added the important 100 and 200 period SMA. This is an important trend indicator for trend trades and mean reversion trades.
  • MACD with Bollinger Bands
    This indicator is a regular MACD but with Bollinger Bands added to it (both default settings).
    When MACD reverses near or at a Bollinger Band, then the reversals have the highest probability of being a real reversal. Beyond the BB’s the probabilities are highest.
    Bullish MACD reversals are indicated by lime colored arrows.
    If price breaks below the lower BB, I wait for MACD to break above the lower BB
    to confirm the bullish reversal (darker green arrows).
    Please mind that MACD is a lagging indicator. So signals come late, but are of a higher probability.
    This is probably my latest favorite indicator. You can switch timeframes on this indicator (independent of the price chart). I found that looking for macd beyond the outher BB ranges, especially confirmed on multiple timeframes, is a very strong trend indication!!
  • Support and Resistance breakout indicator (beta)
    This indicator looks for breakouts above and below the latest highs and lows. 
    A bit similar to “Donchian channels”. You can set the lookback period for the high/lows, and the % breakout. A true and simple breakout indicator.
    (This indicator is not covered in the course, but it’s a nice tool)

Tradingview Indicator Installation Guide:

  • Open a full-featured Tradingview chart.
  • Click on the “Pine Editor” tab on the lower side of the screen:
  • Next click “Open” and “New Blank Indicator”:
  • Now copy the contents of the indicator text file you downloaded from this page.
  • Next paste this text into the Pine Editor in Tradingview
    (make sure this text area is empty before you paste the text):
  • Now save the indicator:
  • And add it to your chart:
  • Now you can exit the Pine Editor again.
  • Next time you want to add the indicator you can find it under the Indicators button, under My Scripts:

Congratulations! You manually added your first Pinescript indicator to your Tradingview account. If you’re interested, Pinescript is a high level scripting language, and has a very easy syntax. Here is the Tradingview documentation of Pinescript:
https://www.tradingview.com/pine-script-reference/