IMPORTANT!
READ CHAPTER 1 FOR FREE
Enroll now & become a Pro Trader today! ➡️
Or read chapter 1 for free first … ⬇️
Preface
Many traders think that knowledge is power, so they acquire as much information as possible. You probably already know all of the indicators you will encounter in this course.
But knowing isn’t enough. You will learn even more when you apply this knowledge. This course will teach you how to apply this knowledge. So eventually this knowledge will become your second nature. Knowing how to trade is not the same as being a good trader.

I guess the only holy grail that can be found in trading, is the trader itself, where all the knowledge comes together by practice.
Learn from your mistakes. In trading we must persevere, and get up when we fall no matter what happens. You’re going to make mistakes and that’s fine. But avoid making the same mistakes twice.
Do you know what Elon Musk, Bill Gates, Warrren Buffet and Mark Zuckerberg all have in common? They all made big mistakes. But they are still here, and all are billionaires, think about that.
You can’t cheat success.
- Success in life is the result of good judgement
- Good judgement is usually the result of experience
- Experience is usually the result of bad judgement
Data Redundancy
Many times I hear newbie traders say that all their indicators gave a buy signal, yet the trade turned against them.
Often this is caused by the fact that each of the indicators they are using actually shows them the exact same information, but only in a different form.
You have to avoid redundancy. Avoid counting the same information more than once. This creates misleading signals and happens when many of the same type of indicators are applied to the same chart.
The way you combine indicators is very important, even more important than the indicators themselves.
Combining them in a wrong way, can lead to confusion, and eventually wrong trades. You have to understand what information an indicator represents before you use it. Combining indicators that actually are based on the same information, gives you a false confirmation. So to make things clear, you have to know which information each indicator represents.
There are basically 3 groups of indicators:
- Momentum indicators
- Trend indicators
- Volatility indicators
You want to combine indicators in a significant way, so you get the best signals and make the best possible trades. When you only use indicators from 1 group, they all show you the same perspective on price behaviour. But you want each indicator to have its own independent perspective on price action. So when they give the same signal it actually means something. Like adding different pieces to the same puzzle.
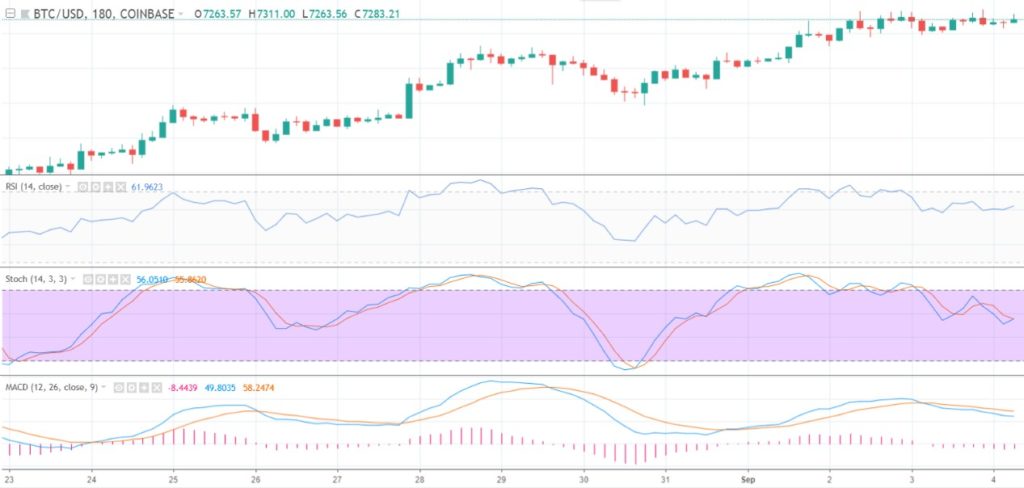
Here I give you an example of 3 indicators of the same type, all Momentum indicators (btw. MACD is also a Trend indicator):
To illustrate this I traced the indicators with the magenta line:
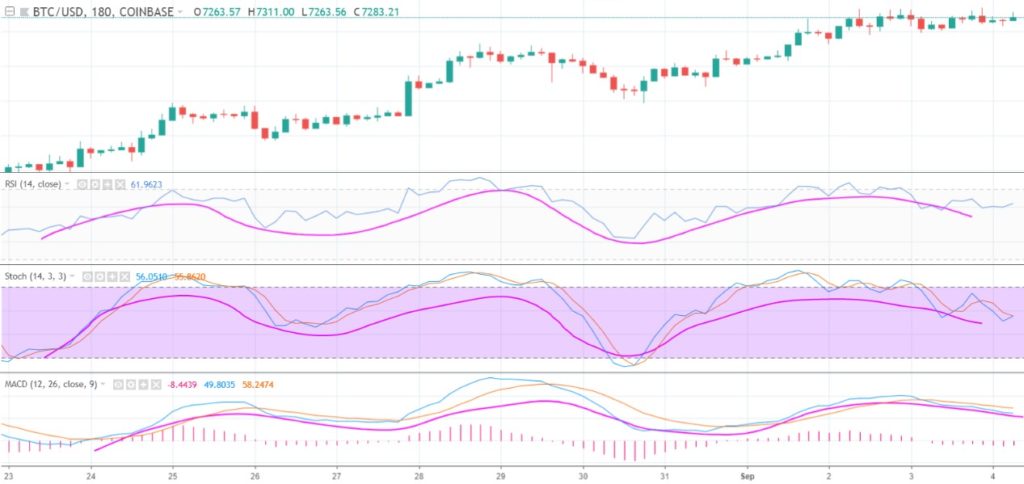
As you see, they don’t complement eachother, but act more like they’re copies of one another. To the untrained eye it could even look like a strong confirmation. Nice detail: it also shows you that the MACD is a “lagging” indicator.
If a trader uses indicators that convey identitical information, he puts too much emphasis on the information provided by those indicators and probably overlooks other important information about price.
In technical analysis you always look for confirmation. But as you see it is very important that information is confirmed by information from a different perspective.
Otherwise you are fooling yourself. You want the different indicators to complement eachother, so that each is an unique piece of the same puzzle.
When trading I am trying to solve a problem: “Should I take this trade now or not?” This reminds me of this quote from Einstein: if he had one hour to save the world he would spend fifty-five minutes defining the problem and only five minutes finding the solution. I think the same is true for trading.
So before jumping to trying to find out if we should buy, it is better to step back and get a better understanding of our chart and situation. So if you want to know if a coins price action means you should buy it now, you can better try to improve your image of what you are looking at, try to see it from different perspectives.
The idea behind this is to let the market decide for us what we should do.
Don’t try to predict the future.
As said, indicators belong to groups, here I have arranged a couple of them. These groups are the actual different perspectives:
- Momentum: Stochastic, RSI, MACD, MFI, Volume analysis
- Trend: Moving averages, MACD, Bollinger Bands, ADX
- Volatility: Bollinger Bands, Standard deviation, ATR
- Charting: Support and Resistance levels, Trendlines, Candlestick patterns
So avoiding the usage of indicators from the same group is an important lesson. By combining indicators in a significant manner you increase your odds.
In the next example I have combined 3 indicators from different groups as an example. The stories they tell complement eachother. So we get a better picture of this potential trade entry:
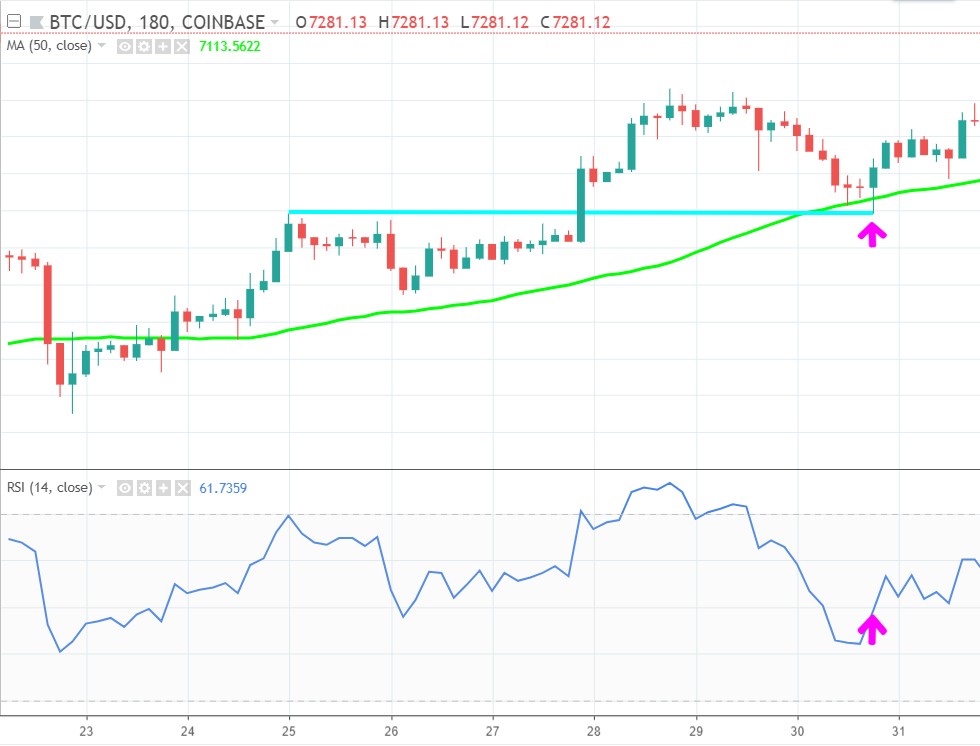
I focus on the area of the arrow. These are the 3 independent confirmations:
- The green line is the 50 period simple moving average, a Trend indicator. It is sloping up, so it is bullish.
- The blue line shows a previous Resistance line (or zone). Often previous Resistances turn into Supports later, called a Support-Resistance reversal. In this case this previous Resistance is now Support.
- Below that I have put a Momentum indicator, the RSI. At the arrow it is sloping up, a bullish signal and it crosses up the 50 line, into bullish territory, at the same time.
So these 3 indicators together paint the picture, that there is a high probability price wil continue the uptrend after the arrow, because:
- Trend is bullish
- price is supported
- Momentum is bullish
So you don’t actually want to use as much tools as possible, but you want the right combination of tools. Technical analysists always look for “confluence”, which means using different indicators and looking for confirmation between them in order to find opportunities.
KEEP IT SIMPLE
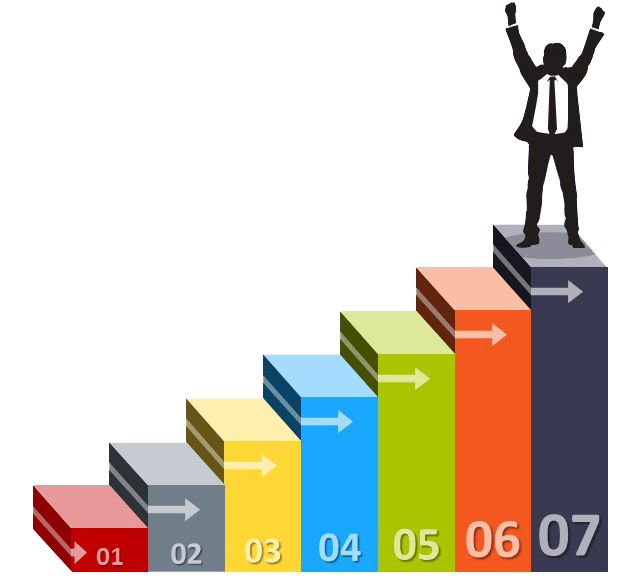
I have actually created this 7-step strategy just to keep it simple. Because trading is complex and confusing enough already. I follow these 7 steps to get the trades with the highest win-rate and reward.
This is what my strategy is based upon. I need to take 7 independent steps before I decide to enter a trade. In short I break down my trade decisions in these 7 steps:
- Trend
- Momentum
- Chart Structures
- Higher Timeframes
- Timing the Trade
- Orderbook Analysis
- Market Correlation
It often reminds me of SpaceX launching a rocket, and all systems have to give a last-minute GO before take-off.

I am used to trade on an 5 minute, 15 minute, and 1 hour charts. That’s what works for me. Look what works best for you.
- Lower timeframes often give more signals, and give them sooner, but of lower quality.
- Higher timeframes give less signals, and lag more, but often give a higher probability.
The 7 step method can be used for both scalping, daytrading, swing trading and even investing. In the next chapters of the Pro Course I will explain each one of these steps. All is accompanied by many real-world examples.
In order continue to the next chapter please enroll in my Pro course !