In basic price-action trend trading we are looking for higher highs and lows to confirm an uptrend (and lower highs and lows to confirm a downtrend). But sometimes when we are in a downtrend and price is making lower lows, the RSI is already making a higher low. This signals a shift in momentum. The downtrend is losing steam. Price and momentum diverge: hence a “divergence”.
As pointed out in the previous lesson, these divergences are “leading signals”, and as such show us an early warning! (as in this image: warning of a 20% down slope up ahead, while the current slope is still flat)

There are two main types of divergences:
- Bullish
- Bearish
Both can be subdivided into 3 categories:
- Strong
- Middle
- Weak
Of these examples, I prefer to trade the strong divergences. The other ones are often less reliable.
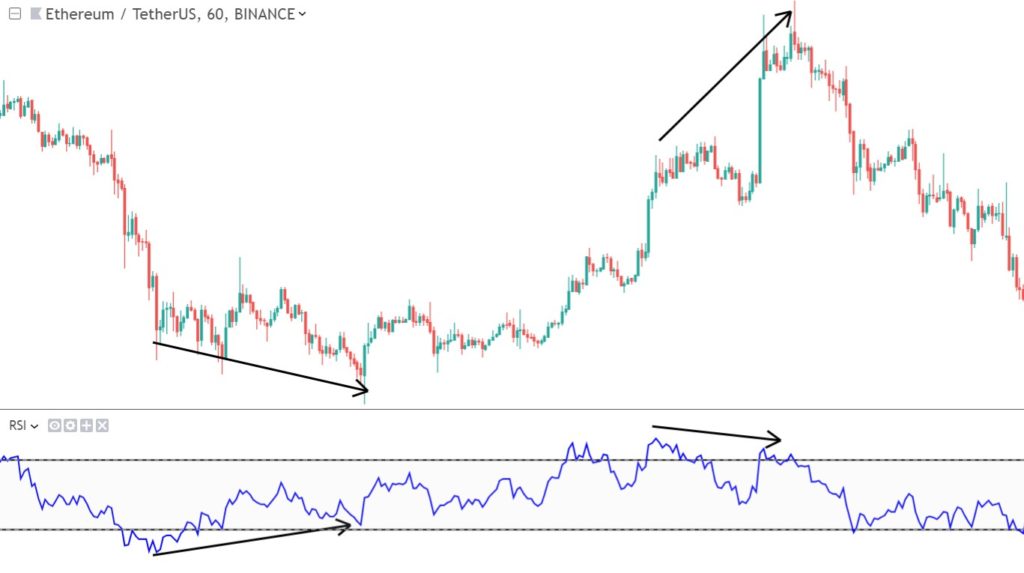
- When we are in a downtrend, and are looking for the end of the downtrend, we wait for a bullish divergence. This means price makes another low, while this is not confirmed, as the indicator fails to make a lower low.
- In an uptrend, when looking for the end of the trend, we wait for a bearish divergence to show up. This is the opposite pattern: price makes a higher high, while the indicator fails to make a higher high.
The indicator you use for this is an oscillator. Specifically a momentum oscillator. I use RSI all the time as momentum indicator. It is also a good indicator to learn reading momentum. When the oscilator shows us a rise or fall in momentum, this actually gives us a an indication of the sentiment in the market: bullish or bearish, greed or fear.
Now let’s look at some charts:
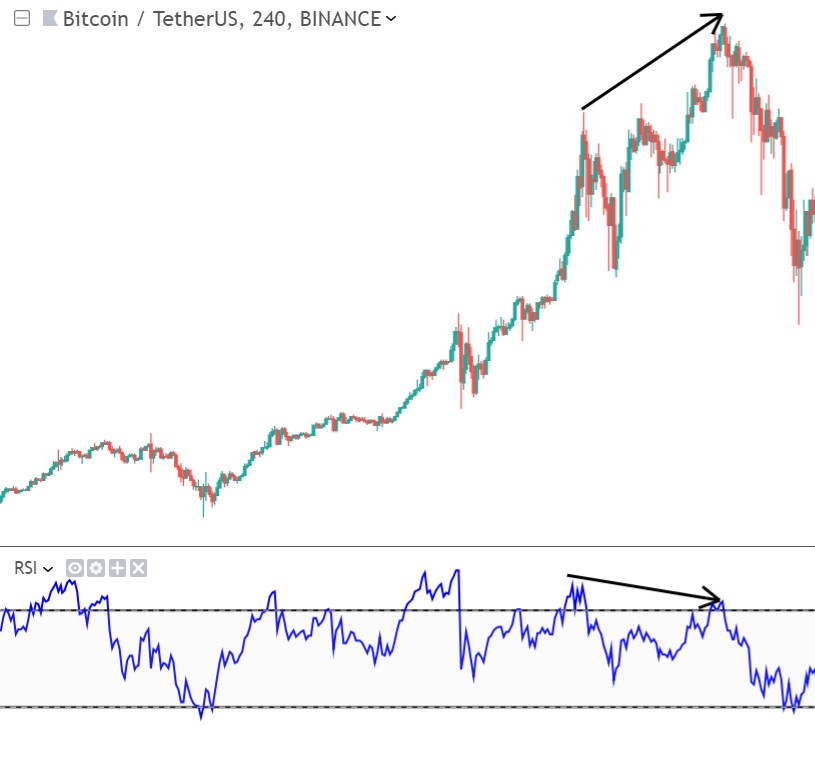
You could have estimated the top of Bitcoin in the december 2017 bullrun quite good:
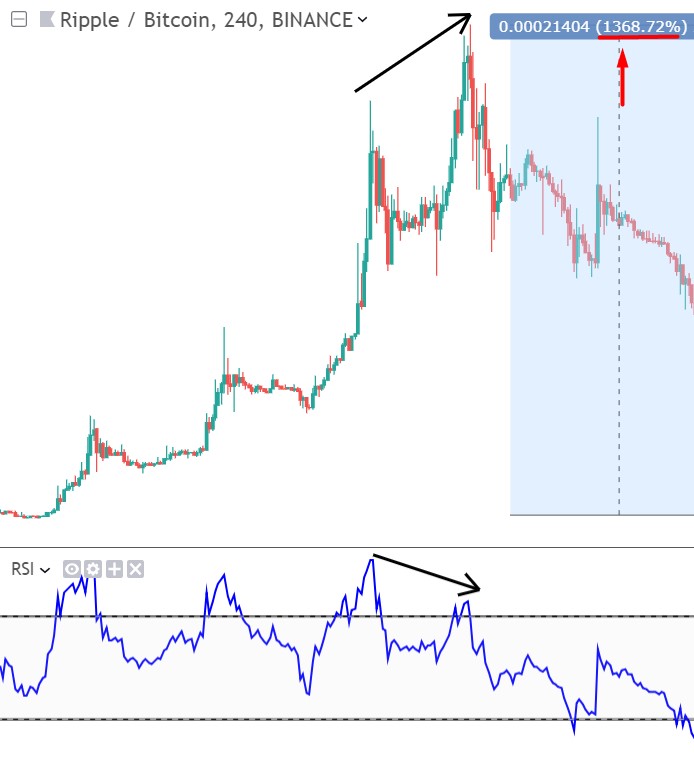
Or imagine you could have predicted the 1300+% ALL TIME HIGH of XRP:
Of course these are extreme examples, but it shows you the strength of this phenomenon. Here an example of a 1 hour chart (Cardano):
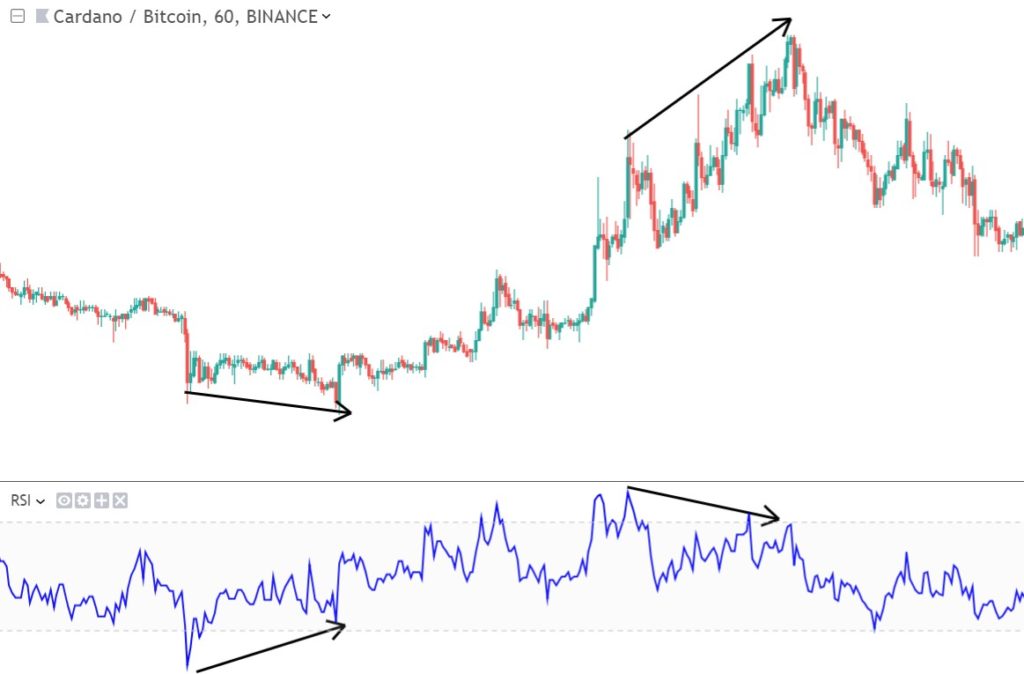
As you can see, it actually works on any timeframe, although it is more reliable on higher timeframes (as is with all indicators).
VERY IMPORTANT :
- Remember this works best with large swings, thus in strong trends. In sideways markets this is not reliable at all !!
- Next to that: always have patience. Often traders enter a trade too soon, right after they saw the divergence. It is much better to wait for an extra confirmation first. Let me show an example of an too early entry. Here I have a chart + RSI that shows you a downtrend and a bullish divergence.
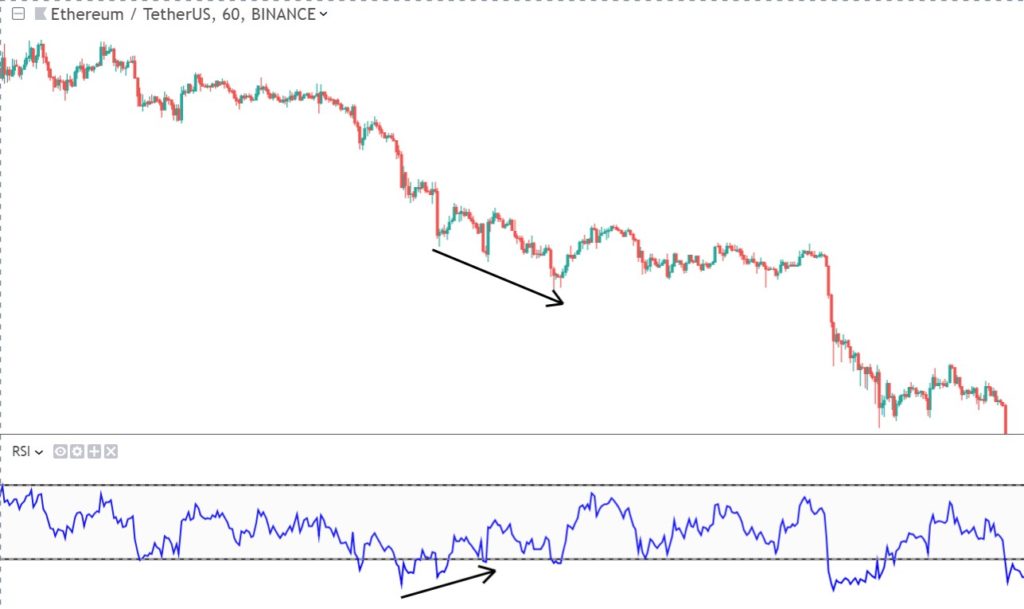
You see? The downtrend continues..
So what you should remember is to look for extra confirmation, starting on the chart and the RSI itself:
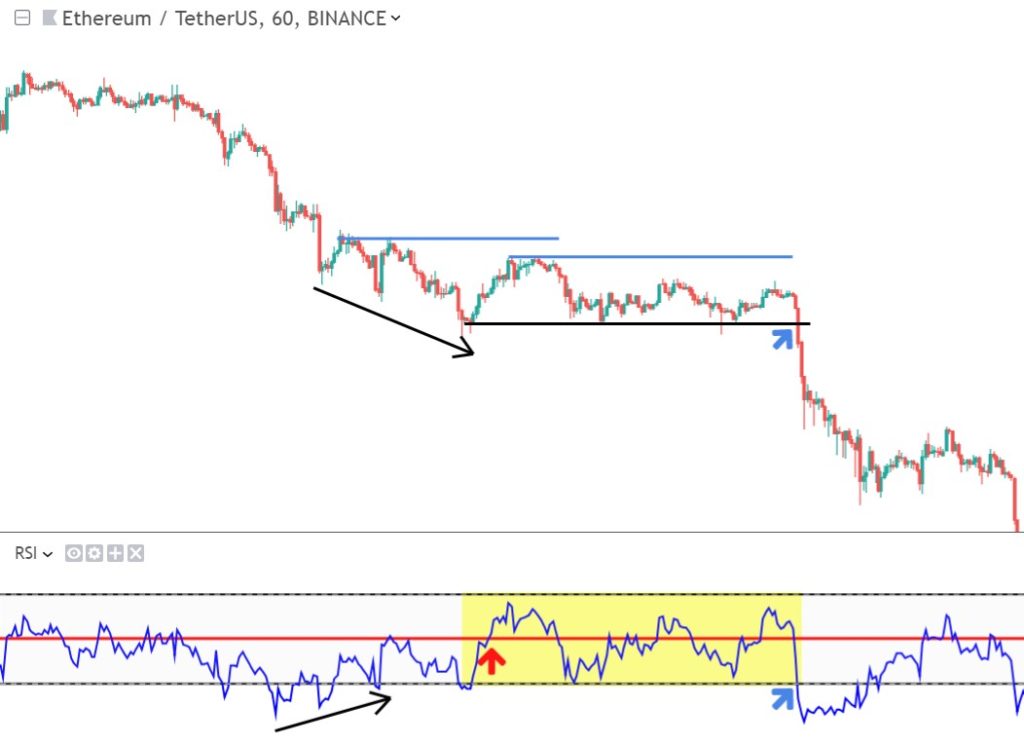
- It starts good, after the bullish divergence formed (black arrows), the RSI breaks above 50 (red line at the red arrow) into bullish territory.
- But next the RSI fails to confirm the uptrend, it doesn’t break above 60 (upper black line).
- RSI continues to go sideways from there (yellow area), fails to break above 60.
- Meanwhile, price action fails to make any higher high (blue resistance lines).
- But after a descending/ sideways kind of consolidation it breaks below support.
- At the same time RSI breaks below 40 (blue arrow) support.
- Downtrend continues.
As you can see, when combining it with basic price action and RSI levels, then you already have a very save system 🙂 Now enjoy! You’re welcome !
You now know what divergences look like. But there is more, there are also “hidden divergences”. As you have seen, the normal divergences are used to spot trend reversal. Hidden divergences are used to spot trend continuations. So we can make yet another subdivision is divergences:
- Normal divergences for early trend reversal signals
- Hidden divergences for early trend continuation signals
So hidden divergences give us the signal that the current trend might continue.
First let’s have a look at what hidden divergences look like:
After you have learned about the “normal” divergences, this might seem a little bit confusing. But look at it this way,
- Bullish hidden divergence: Price itself makes a higher low: a bullish signal. But RSI makes a lower low, a bearish signal? No! It means RSI is (almost) oversold, at the low end of its down cycle, soon ready to start a new up cycle! Even that much bearish momentum, didn’t manage to let price make a lower low! Can only go up!
- Bearish hidden divergence: Price itself makes a lower high: a bearish signal. But RSI makes a higher high, a bullish signal? No! It means RSI is (almost) overbought, at the high end of its up cycle, soon ready to start a new down cycle ! Even that much bullish momentum, didn’t manage to let price make a higher higher! High probability that it will come back down.
Here I have an actual example of a downtrend, that paused, and tried to reverse. But price didn’t manage to make a higher high, even though momentum did its best and pushed all the way up (an exhaustion pattern):
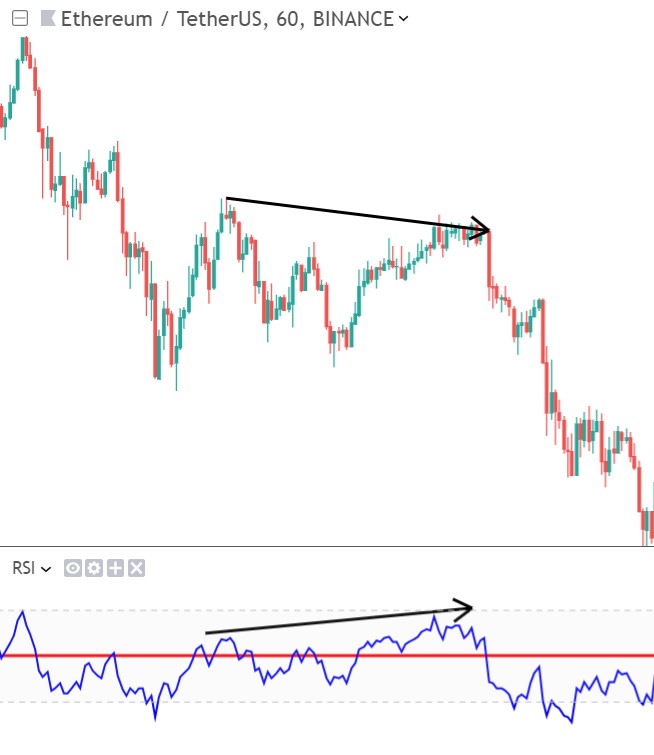
You see, after the hidden bearish divergence, the downtrend continued.
Now you know hot to spot these divergences you will probably see them all the time on your charts. Use it to your advantage!
In the next chapters I will give you a basic introduction into Elliott Wave Theory and Fibonacci levels. You don’t have to believe in these complex theories about waves, to actually use them to your advantage in your trades. Many many traders only use these cyclical patterns. The self-fulfilling nature of them can’t be denied, and as such it is smart to use them.
Or Enroll in the Pro Course & Become a Pro Trader!