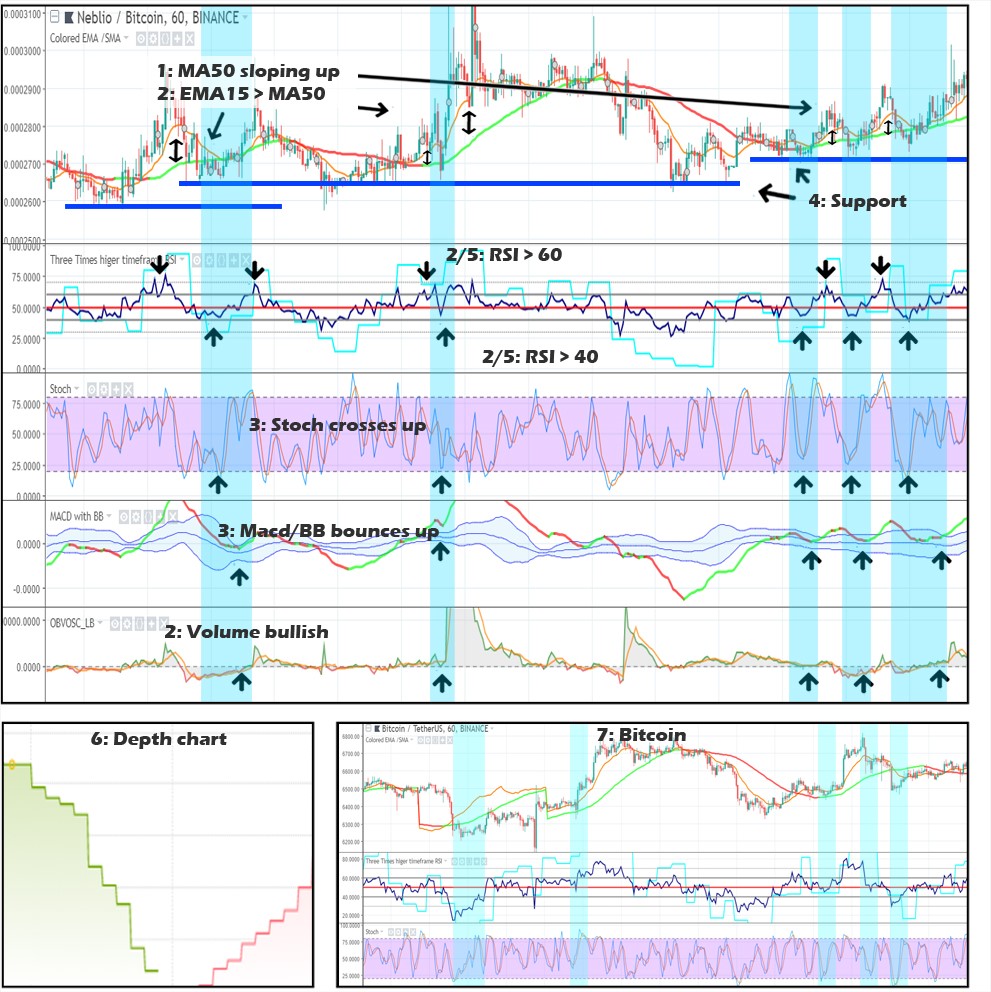
| 1. Trend (SMA50 slope) |  |
| 2. Momentum (RSI, Volume, relation EMA15/MA50) | |
| 3. Timing of entry (Stochastic/ MACD+BB) | |
| 4. Chart Patterns (static/ dynamic support/ resistance) | |
| 5. Higher Timeframe (higher timeframe RSI) | |
| 6. Depth Chart (buyers/ sellers dominance) | |
| 7. Bitcoin Correlation (6 previous steps applied to BTC, correlations Alts-BTC and bigger scale BTC structures) | |