In up- and downtrends, after price has made a nice run into overbought or oversold territory, price often makes a shorter move in the opposite direction. This happens because traders take their profits or losses after the run. These opposite moves are called retracements. And are often called a pullback or a correction.
Price almost never moves in one direction on end, without a retracement or even a short break. In an uptrend it is a drop in price, in a downtrend a jump in price. Often price retraces back to the area of a major moving average.
In a late trend, you have to be careful with these retracements, as they can become complex retraces, that drop further down, and turn into trend reversals.
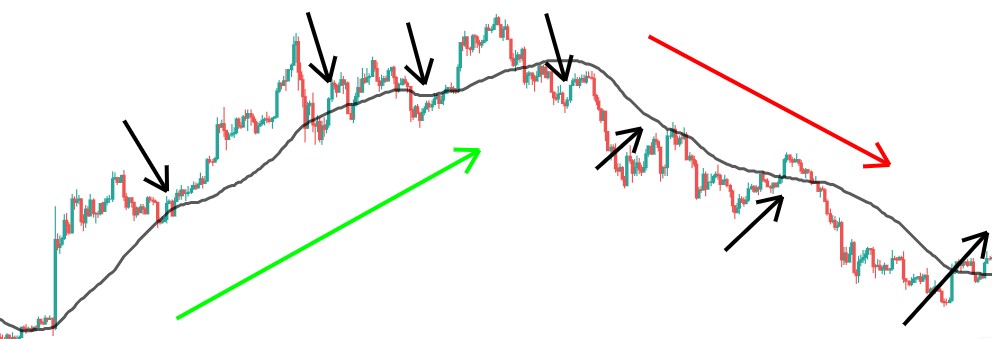
In the next chart example, I show you a typical uptrend. The back line is a 50 period SMA (Simple Moving Average). As you probably already now moving averages act as support in an uptrend, and as resistance in a downtrend.
The black arrows represent the retracements. You see that after 3 retraces, the fourth one turns into a complex (ABC) retrace that fails to stay above the SMA. Next the retracement turns into a complete trend reversal. In the subsequent downtrend you see the retraces are to the upside.
The main takeaway for me is that you have to be careful trading retracements late in a trend. Most trends lose their strength after three up-waves.
Also retracements often bounce off of major support and resistance zones, and at round numbers the effect is even stronger / there is a higher probability.
When the retracements happens in big red candles, this means there is panic.
Irrational behaviour: be very careful. People say: “Never catch a falling knife” for obvious reasons.
Or Enroll in the Pro Course & Become a Pro Trader!