In this post I will focus on the statistical phenomenon behind my favourite trade setup: the mean reversion trade.
Another word for mean is normal. What is normal? I focus on what is normal, in order to find what is abnormal. I am looking for extremes, for irrational price behaviour.
The statistical phenomenon I am referring to is the “reversion to the mean”.
This is about price moving away from averages at highs and lows, but eventually returning to the mean again.
Most of the time a coin moves within a particular range, be it up, down, or sideways.
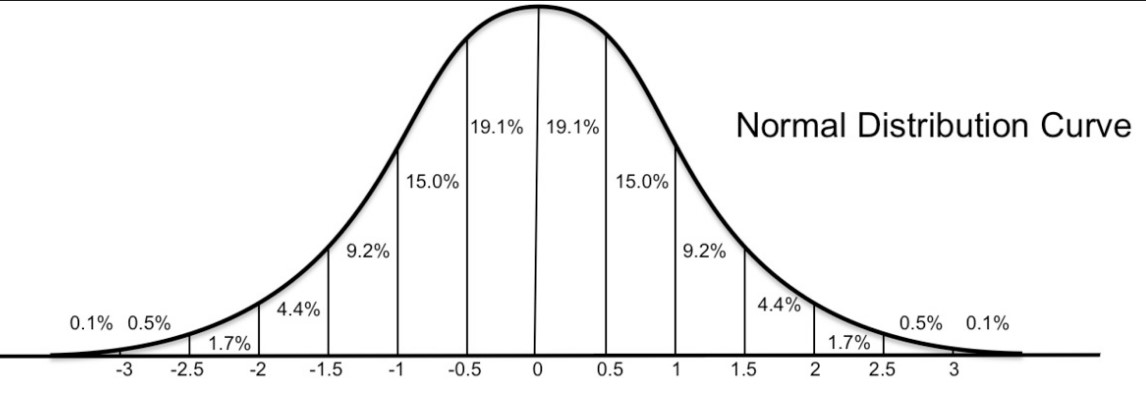
When price is normally distributed within this range, then you can expect deviations to reverse back to the average. As you also see this in the statistical concept of the normal distribution. At the middle of this bell shaped curve you’ll get the highest probability. At the edges you get the lowest probabilities.

The “normal” is that part of the measured data that occurs the most frequently.
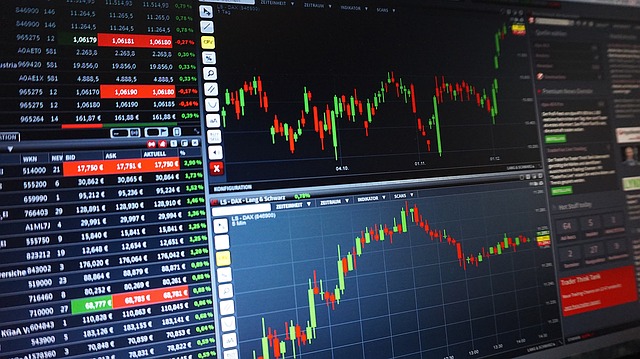
On a price chart this means we have an average price, and price deviating above or below it. In uptrends it deviates more to the upside of the average, and in a downtrend more to the downside.
Crypto markets (and many other markets) aren’t really normally distributed. Although it looks like that often. Price can deviate far more from the mean, than a statistical “standard deviation”. The market can really move against you, at any time, always keep that in mind.
How do you trade this deviation from the mean?
To trade a reversion-to-the-mean setup, we need to know the average price over a previous period. Next the general idea is to buy when price deviates to the downside, and sell when it deviates to the upside.
My mean-reversion method basics:
- Always trade towards the mean: buy below the mean, short above the mean.
- Only buy in uptrend, only short in downtrend.
How do you know the average in an up- or downtrend ?
By using the right moving average.
Using Technical Analysis you want to determine :
- Is this coin trending?
- Is it a strong trend?
- Is it still an early trend?
- Is price deviating from the trend?
All this can be deduced by using the right moving average.
I prefer the 50 and 200 period moving average.
Or Enroll in the Pro Course & Become a Pro Trader!

