
In this blogpost I will take an in-depth look into Fibonaci levels. But first we go to the early 1900’s.
Gann
A trader named W.D. Gann found out that in many of his trades the correction (retracement) waves found support around 50% of the length of the original impulse wave, like in this example.
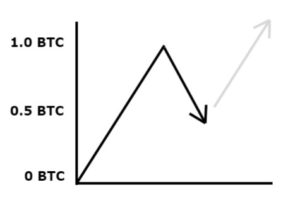
He stated that the 50% level was very important, because if price dropped below it, it often meant a full 100% reversal. And if price managed to stay above the 50% level, it often indicated trend continuation.
He also recognized the 25% level as an often occurring support zone.
When price drops 100%, then it forms a double-bottom (as mentioned in the chart pattern lesson), thus still a bullish formation.
Fibonacci Sequence
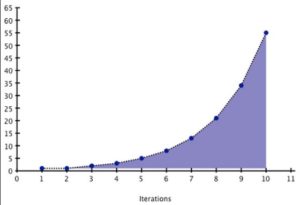
This Gann method was an earlier and more simplistic theory about retracements (correction waves). Fibonacci is another more widely used theory. It is based on the Fibonacci number sequence, named after the 13th century mathematician. The Fibonacci sequence goes like this:
0, 1, 1, 2, 3, 5, 8, 13, 21, 34, …
The next number is found by adding up the two numbers before it. Theoretically it continues to infinity. The ratio between any 2 consecutive numbers is: 1.618 (or its inverse 0.618). This is also called the “Golden Ratio”.
It is actually an exponential sequence. A growth pattern. That’s why you see it often in nature, as growth is a key part in nature and evolution.
Fibonacci and Elliott Waves
Elliott found out that his wave patterns were related to this Fibonacci sequence.
“The Fibonacci Summation Series is the basis of The Wave Principle”.
– Ralph Nelson Elliott
In trading we usually use the fibonacci ratios instead of the Fibonacci numbers themselves. As said you get these numbers by dividing one Fibonacci number by another one. In Elliott Wave Theory you use Fibonacci ratios as potential levels where impulse and correction waves begin and end. These are common levels:
- 0.236
- 0.352
- 0.5
- 0.618
- 0.786
0.5 (50%) is not a Fibonacci level, but is used often. Probably the legacy of Gann 🙂
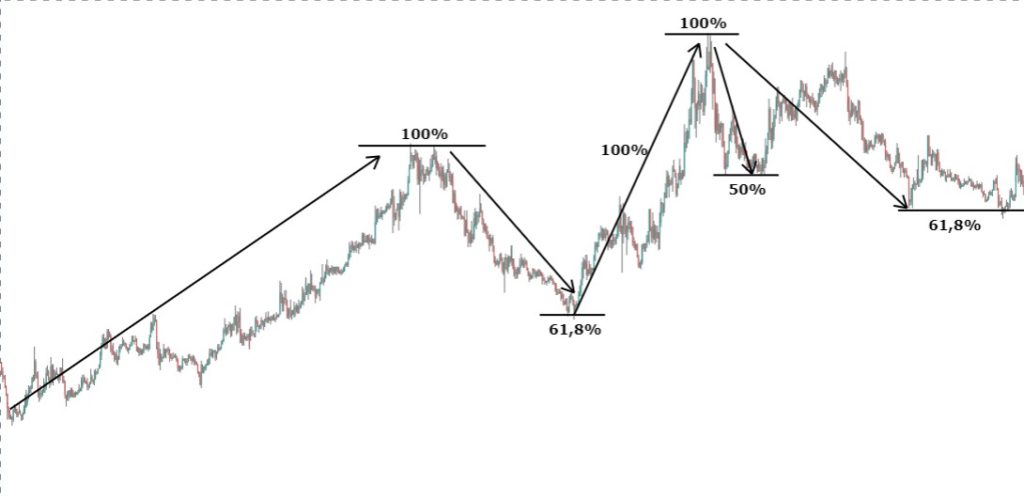
You use these ratios to determine retracement levels, you want to measure where a retracement will find support. For impulse waves you just add 1 to the ratios:
- 1.236
- 1.352
- 1.5
- 1.618
- 1.786
In the example below, the December 2017 Bitcoin bullrun. It’s very clear to see, that after the all-time-high (at the $19k zone), when price retraced back, the first support it ran into was the Fibonacci 1.618 level (at the blue arrow):
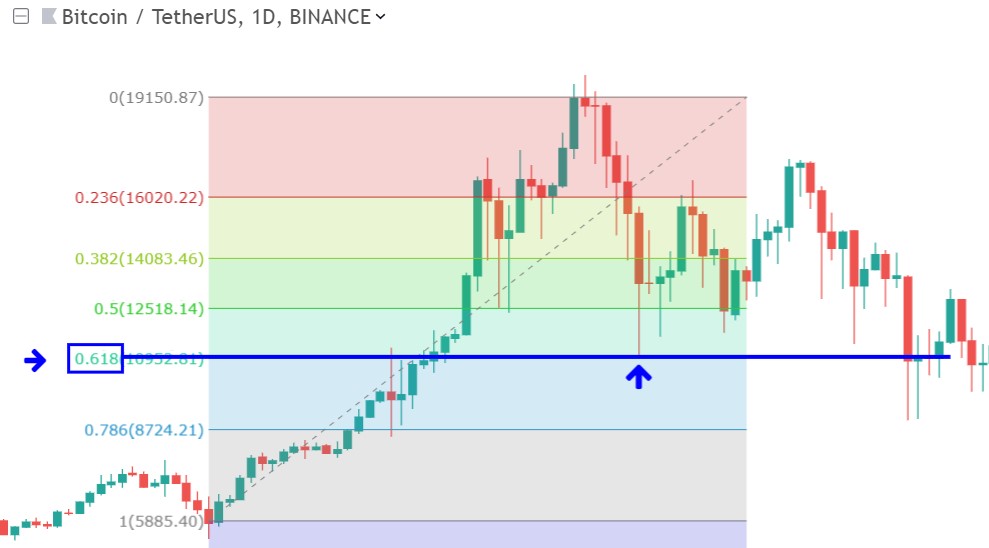
But also the 50% level played an important role, as it actually closed its daily candles at that level short thereafter.
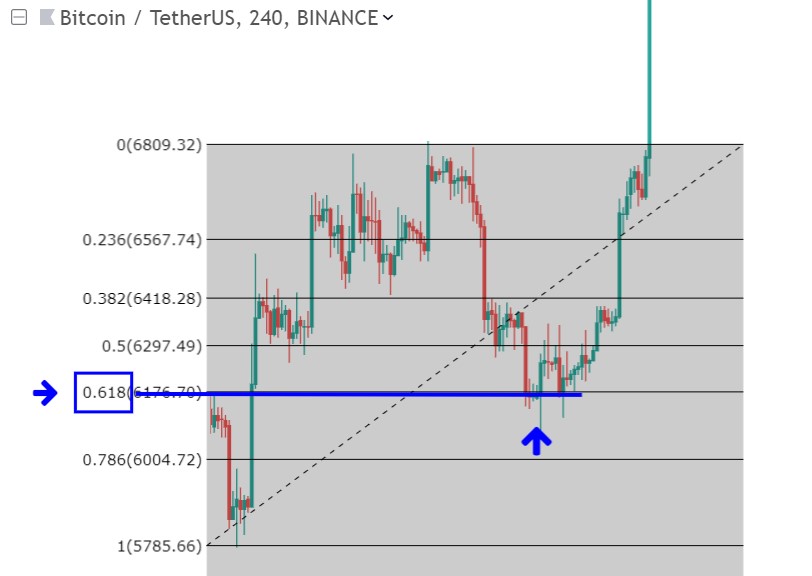
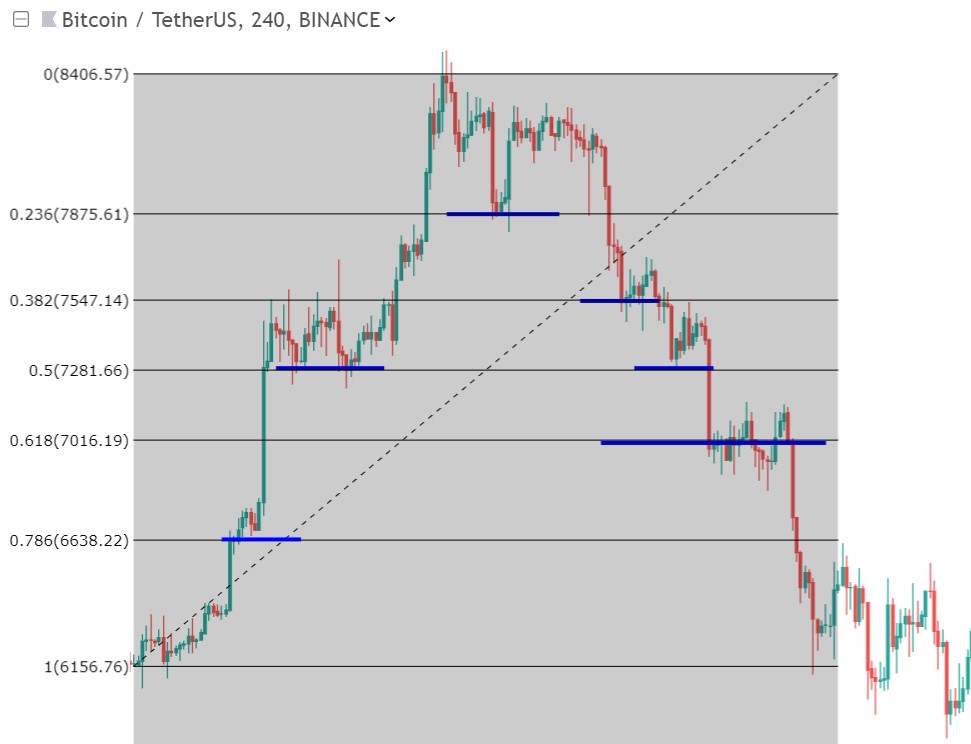
Below another example on a lower 4h timeframe, also respects the 0.618 level in the first retracement:
Below 2 examples that show charts where many Fibonacci levels seem to play a role as support or resistance:
In my own trading method I don’t really rely heavily on Elliott Wave patterns or Fibo levels. I often find it too subjective and the concept of waves within waves can make it very complex and confusing. It sometimes feels more like an art to me.
But when trading near major swing highs and lows I always look at these levels. Plot them on my chart and try to find confluence with other indicators.
Even if you think that the Fibonacci Theory lacks real scientific truth, the fact that many traders use these levels in their trades, gives it a real effect on price. So why not use this to your advantage? The self-fulfilling quality of many TA tools can’t be denied. Sorry if I’m starting to sound like a broken record. But I can’t emphasize this enough 🙂
Or Enroll in the Pro Course & Become a Pro Trader!