
As I showed you in the market lesson, the market moves in waves, as a whole, and on all other levels as well. It moves like the oceans, it ebbs and flows. All moves on a chart consist of shorter counter-moves.
As I mentioned earlier, these 2 directions of the market are basically caused by psychology: greed an fear, called FOMO and FUD among crypto traders. Traders just want to lock in some profits, in case the market turns against them. This causes the short lived counter-moves, after which the trend often continues. So there are basically two kind of directions in the market.
- moves in the direction of the trend
- counter-trend moves
As is shown in this chart example:

“what goes up must come down”
When traders talk about waves, they often mean “Elliott waves”. Elliott Wave Theory was invented by Ralph Nelson Elliott.
It is beyond the scope of this lesson to go into Elliott Wave Theory in full-scale. But this will give a novice trader a very good starting point. I will give you a broad overview of the theory with some examples. But realise this is a very detailed and rich theory.
As said earlier, the waves in the market coincide with the greed and fear of traders and investors. This was also Elliott’s proposal. Elliott developed the idea that markets weren’t random, but that they behaved in patterns. Mass psychology occured in the same patterns as the patterns he could distinguish in the market. Next to that he found out the patterns were recurring and happened on all timescales, it was fractal in nature.
Traders often like to use Elliott waves, because it gives them a clear framework to work with. And it gives them a tool that helps predict tops, bottoms, highs and lows in a trend.
The Elliott Wave theory states that there are two types of waves:
- The wave in the direction of the trend: “impulse wave”
- The counter-trend wave: “correction wave”
The impulse wave consists of five price movements. Three waves in the direction of the trend and 2 in counter-trend waves. Below an example of an impulse wave in an uptrend (left) and a downtrend:

According to the Elliott Wave theory, the impulse waves must be followed by correction waves. These are waves that move against the dominant trend. Elliott uses the scientific principle “what goes up must come down.” Usually the correction waves will consist of three waves and are labeled as A, B and C.

The counter-trend abc move consists of 2 impulse waves (down) a and c, and 1 correction wave (up) b.
Below I will give a more in-depth look into the 5 waves in an impulse move:
Wave 1
When a new trend begins, at the first impulse wave (1), it is often not yet obvious you are in a new trend. As many traders are more conservative, they don’t just buy the break-out, but await the first retest of the previous resistance as support. That’s why most trends gain more momentum and volume after this.
Wave 2
Wave 2 is the correction of wave 1, it can never retrace beyond the starting point of wave 1. Many traders are still hesitant, and wait for confirmation of the new trend. You should see that volume is lower than in the first impulse wave (buyers are dominant). Wave 2 usually does not retrace further than 61.8%, a Fibonacci level. More about Fibonacci retracements later.
Wave 3
Elliott Wave Theory states that usually wave 3 is the largest wave. It is the wave with the most strength, as most traders have entered the market after the first retracement (wave 2). The majority of the crowd has entered by now, especially when wave 3 breaks above the top of wave 1, as the SL orders (of the shorters) above wave 1 will be bought back. Wave 3 is often larger than wave 1 with a ratio of 1.618:1.
Wave 4
Wave 4 is another correction wave, but volume is well below that of wave 3. Wave 4 often retraces less than 38.2% of wave 3. This is another good entry into the trend, as you expect the 5th wave up. This is often a good location to enter a mean-reversion setup.
Wave 5
Wave 5 is the final wave in the direction of the dominant trend. This is when the news has also picked up the momentum, and many unexperienced retail traders enter the market, even though momentum is clearly decreasing. That’s why people say “buy the rumor, sell the news”.
Volume is often lower than in wave 3. And although price does make a higher high, momentum often fails to do so, signalling a “divergence”.
ABC Waves
- Wave A consists of 5 waves and is often misinterpreted to be a correction wave of the previous bullish trend. Often there is a rise is volume, as the sellers step in.
- Wave B consists of 3 waves is often misinterpreted as a continuation of the previous trend. Wave B’s high is often the right shoulder of a head-and-shoulders pattern. Volume is lower than in wave A.
- Wave C consists of 5 waves in the opposite direction of the previous trend. The majority of the crowd now realizes we’re in a new trend. Usually wave C is larger than wave A, and most of the times wave C is larger than wave 1 with a ratio of 1.618:1 or higher.
Traders prefer to enter in an early impulse wave, and exit after the 5 wave structure is completed.
As said the Elliott Wave Theory is fractal in nature. It occurs at all timescales. Elliott identified nine types of waves, which he labeled as follows, from largest timescale (higher degree) to smallest timescale (lesser degree):
- Grand Supercycle
- Supercycle
- Cycle
- Primary
- Intermediate
- Minor
- Minute
- Minuette
- Sub-Minuette
There are 5 different kind of correction patterns:
- Zigzag (5-3-5)
- Flat (3-3-5)
- Triangle (3-3-3-3-3)
- Double three: A combination of two of the above patterns (1, 2, 3)
- Triple three: A combination of three of the above patterns (1, 2, 3)
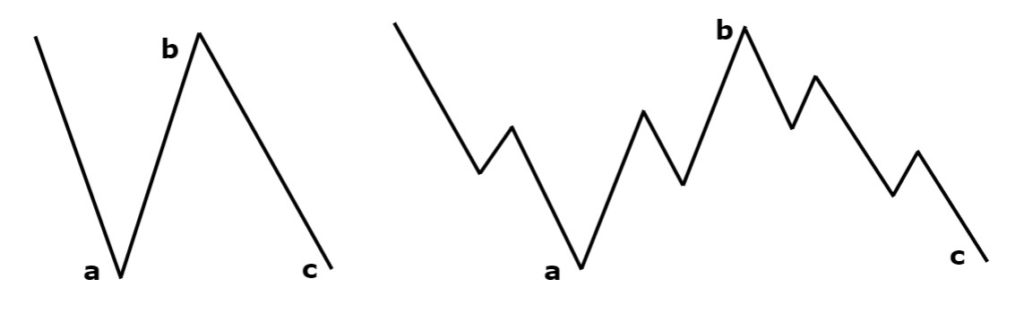
Zig-Zag (5-3-5) ABC correction pattern
A zigzag formation is a formation that consists of 3 large waves each consisting of a number of smaller waves.
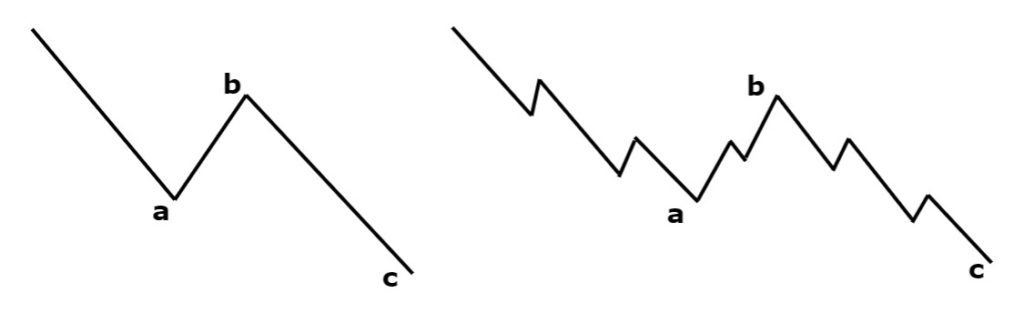
- Impulse wave A consists of 5 sub-waves
- Corrrection wave B consists of 3 sub-waves
- Impulse wave C consists like wave A of 5 sub-waves
This correction pattern usually goes to 61.8% or 50% Fibonacci retracement of the impulse wave. More about Fibonacci retracements later.
The Flat (3-3-5) ABC correction pattern
The second correction wave is the Flat. A Flat is a combination of lateral movements that usually have the same length.
- Impulse wave A consists of 3 sub-waves
- Corrrection wave B consists of 3 sub-waves
- Impulse wave C consists of 5 sub-waves
The Triangle (3-3-3-3-3) ABCDE correction patterns
The second correction wave is the Flat. A Flat is a combination of lateral movements that usually have the same length. Below examples of bearish and bullish symmetrical triangle patterns:


There are also ascending, descending and expanding versions btw.
Three Rules of Elliott
Because the counting of waves is a very subjective method, there are three rules that you must take into account if you use the Elliott Wave Theory:
- In an impulse wave, the wave 3 can never be the smallest wave. Generally, wave 3 is the largest wave in an impulse movement.
- In an impulse wave, wave 2 can never go beyond the starting point of wave 1.
- The starting point of wave 4 can never be lower than the end point of wave 1 (except in the case of a triangle pattern)
If these rules are broken we have an “Elliot Wave failure”
Means we don’t really have a true Elliott wave pattern.
Here an animated example, of an Elliott wave pattern on the BTC chart:
Now you have set your first steps in the world of Elliott Waves Theory. As you have seen, Elliott Waves Theory is related to Fibonacci levels. In the next blogpost I will dive deeper into Fibonacci levels as trading tool.
Or Enroll in the Pro Course & Become a Pro Trader!