Simple Guide to Support and Resistance (Crypto Trading)

  • admin 

Support and Resistance are the two most frequently used terms in technical analysis. Support and Resistance are price levels where the price could not go below or above in the past. So they are barieres for the price.

If the price of a coin falls, the demand for the coin will increase accordingly. That lower price level is interesting for buyers, so they “support” that price. This becomes visible on the chart because the price does not seem to fall below that price level. Due to the increased demand, the price is rising again. This price level is called support.

As soon as a support or resistance becomes visible on the chart, it serves as a potential buying or selling zone for traders. If the price comes close to such a zone, it can do two things:

  • bounce off of the support or resistance
  • break through the support or resistance

Many traders trade either of these two directions. 

If the price turns out to go in the wrong direction, they close their position with a small loss, but if it goes in the expected direction, this can lead to a considerable profit.

In trending markets, support and resistance form swing highs and lows. 

  • In an uptrend the previous resistance swing point acts as a new support level
  • In a downtrend the old support swing point acts as a new resistance level

Supports turning into resistance, and resistances turning into support are a common phenomenon on charts. In TA it is called a support-resistance-reversal. See the example below to learn more:

The dashed lines in this illustration show how the previous swing highs/ resistances act as a support level after the breakout. When the market makes a retracement move down it respects the previous swing high as a new support level, which is also the beginning of another impulsive move up. 

By drawing these support/ resistance lines, we can predict high probability zones for reversal and can better time when the retracement will end and the impulse wave will start. Here you see a real-world example of an uptrend on a chart:

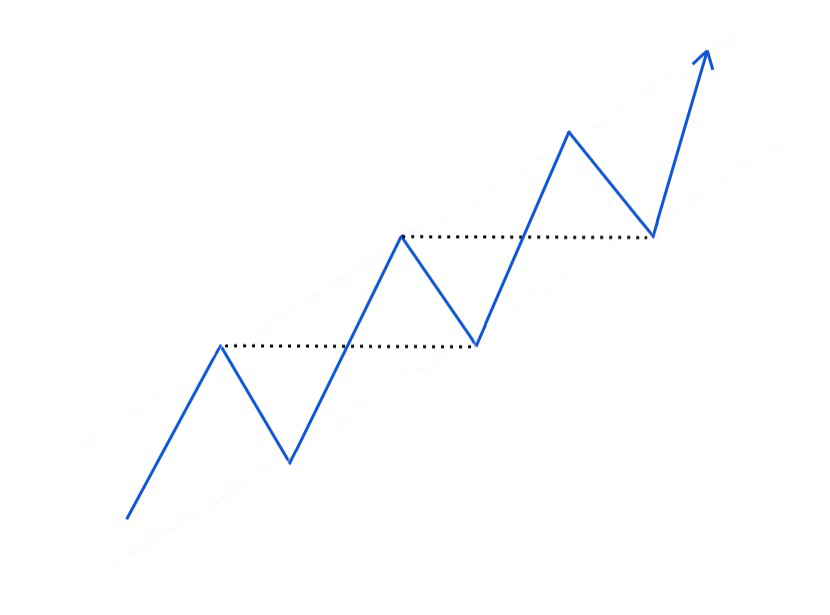
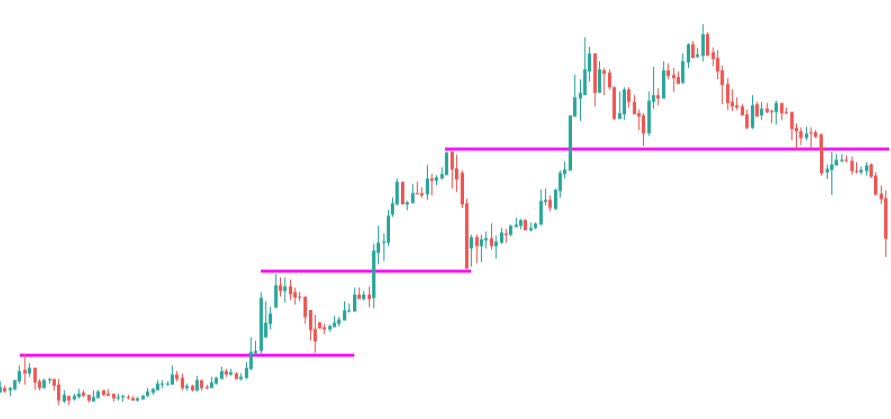
As you see trend continuation depends on these support-resistance reversals. When price fails to break such a level, this signals the end of a trend or even a trend reversal, as you can see happened at the right side of the above chart.

When the market can not get through a price level even after repeatedly testing it, this is also called a “ceiling”. And at a bottom where the price does not seem to be able to break below, even after repeatedly testing it, is called a “floor”. Here you see an example of a ceiling:

ta-trendlines4

Next to the static Support and Resistance lines (they are actually more like zones btw.), there are also dynamic Support and Resistance lines. These are formed by Moving Averages. In uptrends Moving Averages act as support zones. And in downtrends they act as zones of resistance. More about that in the next chapter.

In the next free lesson I will show you how trends form trendlines on a chart.

Or Enroll in the Pro Course & Become a Pro Trader!

The #1 Crypto Trading Course.
Learn How To Profit Today!