Basic Guide to Supply and Demand (Crypto Markets)

  • admin 

I have an holistic view on how financial markets function. In my mind the market as a whole acts as a giant sinus wave:

A wave is in essence a cycle (circle) projected forward in time.
It is the interaction between two opposites, supply and demand, that try to achieve balance.

It is like the heartbeat of the market, echoing on every level. Because you see it at all levels, means it is fractal in nature. Even the smallest candles represent this structure also.

Balance

The high volatility in crypto is because it’s a new market, and traders don’t know what to expect. So it goes to extreme swing highs /lows first, just to find out what it is.  When suppliers and demanders find balance between price and quantity
this is called price discovery.

I like to compare it to a tug of war:

This is about balanced and unbalanced forces. In a tug of war, each side exerts a force on the rope. If the opposing forces are equal, they are balanced and the rope doesn’t move.
If one force is greater than the other, the forces are unbalanced and the rope moves in the direction of the greater force.

Break-out (of balance)

If buyers and sellers are pulling as hard as they can, but both forces are equal, then there is balance. But as in a symmetrical triangle, if both parties are starting to pull less and less, but forces remain equal, there comes a point where both parties are in balance almost without pulling: the tip of the triangle. Then it becomes very easy for one party to start pulling with much force, surprising the other party, and using the imbalance between the forces to win: a break-out out of the triangle.

In a tug of war, if one side wins, the game is over. But in real markets this game is repeated constantly. It’s called the market cycle, and it could go on forever in theory.
Only individual players are thrown out of the game, but as a whole it continues to find balance in the middle between infinite bullrun or absolute market crash. The crypto market is still young, and the dualistic question remains, is it a hype or the future? For now the truth lies in the middle and it remains a little bit of both.

Yin and Yang

My holistic ideas about the market are similar to those expressed by Munehisa Homma, who I consider to be the “godfather” of the candlestick chart, price patterns, price action and Technical Analysis. 
Homma described the rotation of Yang and Yin, as the rotation of bull and bear markets, and claims that within each type of market is an instance of the other type.

This is also the essence of my trading philosophy. I am a trend trader and I only trade in the direction of the trend. I prefer to buy the lows in an uptrend, these are the small downward cycles in the larger upward trending market cycle, I see them as the black Yin spot in the upward white Yang side of the Yin Yang symbol:

And reversed the downward Yin side is an analogy for a downtrending market, where the white Yang spot represents the upward retraces I prefer to short:

But the most important aspect of this analogy is:

  • an uptrending market has downtrending elements in it
  • a downtrending market has uptrending elements in it. 

In each force, the opposing force plays a central role. The opposing movements also play a central role in my method. The retracements are exactly the opportunities I prefer to enter the market. 

Trend

Trending markets are characterized by a pattern of:

  • higher highs and higher lows (in uptrending markets)
  • lower highs and lower lows (in downtrending markets)

See in the examples below how an uptrend is built by price making higher highs and lows, and that a downtrend consists of lower highs and lows:

As you see price needs to break above or below a previous high or low to make a higher high or lower low, illustrated by the dashed lines. These are basically “supports” and “resistances” and once broken they often switch roles, but more about that later.

My Trading Method

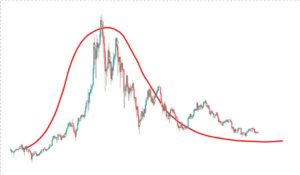
In my trading method I also rely heavily on moving averages to determine the trend. This proved to be very reliable, as many traders use these, and act accordingly, making this self-fulfilling. In fact most of Technical Analysis is self-fulfilling, because of that, and that is a good thing, because it allows us to make money. If you only rely on higher highs and lower lows to enter a trend, you can get stuck more often, as markets only trend 30% of the time. To determine the trend of a market I usually look at the 1 hour chart, lower timeframes are less suitable for this. As said I use uptrending markets to buy and downtrending markets to short.

How do you determine entries? As I have shown in the examples above, trending markets consist of moves in the direction of the trend, or “impulse” waves, and moves against the direction of the trend, or “retracements”

In this example of an uptrend, at the numbers 1, 2 and 3 you see impulse waves, and at the letters A and B you see the retracements.
The best place to buy is at the start of an impulse wave, at the end of a retracement. Thats why my trading method is build around finding the bottoms of these retracements and timing it right.

Or Enroll in the Pro Course & Become a Pro Trader!

The #1 Crypto Trading Course.
Learn How To Profit Today!